 Logicmojo - Updated Nov 11, 2021
Supervised learning is a significant field of machine learning, where the aim is to predict an output given some inputs. The output value could be
a variable with a numeric or category value. We will talk about logistic regression in this post. This supervised learning approach may be used to categorise
data into groups, or classes, by estimating the likelihood that an observation belongs to a given class based on its attributes.
Logistic regression is frequently used for binary classification, i.e. identifying which of two groups a data point belongs to or whether an event will occur
or not, even though it can be expanded to more than two categories. We shall emphasise binary logistic regression in this essay.
Logistic Regression In essence, machine learning is a classification technique that falls under the Supervised category of machine learning algorithms
(a sort of machine learning in which computers are trained using "labelled" data, and the output is predicted on the basis of that trained data).
This merely implies that it traces its origins back to the study of statistics.
A categorical dependent variable's output can be predicted using logistic regression as part of machine learning by using a collection of independent factors.
In plain English, a categorical dependent variable is one whose data is recorded as either 1 (stands for success/yes) or 0 (stands for failure/no) and is
dichotomous or binary in nature.
Logistic Function (Sigmoid Function)
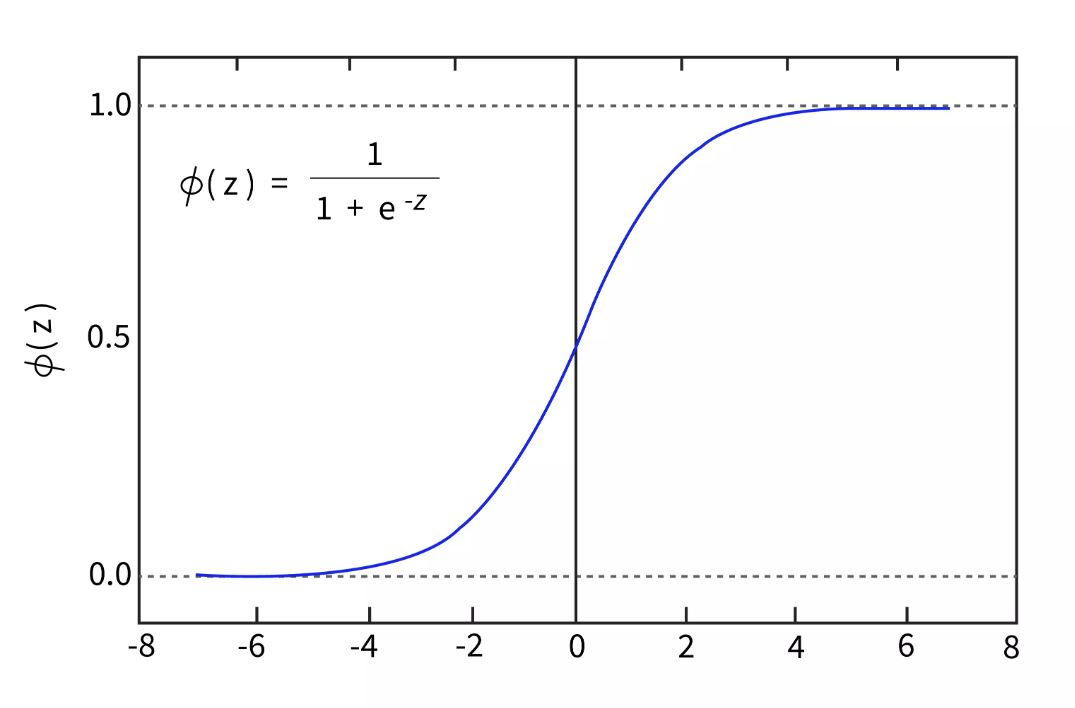
The algorithm for logistic regression also predicts a value using a linear equation and independent predictors. Anywhere from negative infinity to positive infinity can be the expected value. The algorithm's output must be a class variable, i.e., 0-no, 1-yes. As a result, we condense the linear equation's output into the range [0,1]. We employ the sigmoid function to compress the projected value between 0 and 1.
In a logistic regression model, the sigmoid function is written as 1 / (1 + e-value) 1/(1 + e value). where the value corresponds to the actual numerical number you want to modify and e is the natural log's base.

Logistic Regression Types
However, it may also predict different sorts of dependent variables. In general, logistic regression refers to binary logistic regression with binary target/dependent variables, which is where our dependent variables are categorical (categorical dependent variables are specified as previously). Based on the quantity of categories, the types of logistic regression are as follows:
Machine learning for binary or binomial logistic regression: In this sort of classification, the dependent variable will only have two potential states, such as 0/1, yes/no, pass/fail, win/loss, etc.
Multinomial Logistic Regression Machine Learning: This type of classification allows the dependant variable to have three or more different unordered groups or types without any quantitative relevance.
Example:
Students must select a programme from among general, vocational, and academic options before applying for high school entrance. Using their writing score and socio economic standing, their choice might be transformed into a model. Regression using Ordinal Logistic 3. Machine learning: In this style of categorization, the dependent variable may have three or more alternative ordered groups or types without any quantitative significance.
Example:
We can forecast whether a person would see something as Too Little, About Right, or Too Much. Based on variables like the person's nation, gender, age, etc., the government's endeavour to decrease poverty has three possibilities (this dependent variable has three alternatives in order).
Prepare Data for Logistic Regression
Similar to the assumptions used in linear regression, logistic regression makes assumptions about the distribution and relationships in your data.
These assumptions have undergone extensive research, and exact probabilistic and statistical language is utilised. My recommendation is to experiment with
various data preparation strategies while using these as general recommendations or rules of thumb.
In projects involving predictive modelling and machine learning, your ultimate goal is to make precise predictions rather than to interpret the findings. As long as the model is reliable and effective, you can thus violate some of the assumptions.
⮞ Binary Output Variable: Since we've just discussed it, it might be easy to say that logistic regression is designed for binary (two-class) classification issues. It will forecast the likelihood that an instance will belong to the default class, which may be classified as a 0 or 1.
⮞ Reduce Noise: Because logit regression presumes no mistake in the output variable (y), you might want to remove outliers and cases that might have been incorrectly classified from your training data.
⮞ Remove Correlated Inputs: Similar to linear regression, if you have numerous strongly correlated inputs, the model may overfit. Think about determining the pairwise correlations between all inputs and eliminating inputs with a strong correlation.

What makes logistic regression so well-liked?
Because it can transform the values of logits (logodds), which can range from -infinity to +infinity, to a range between 0 and 1, logistic regressio n is well known. Since logistic functions produce the likelihood that an event will occur, they can be used in a wide variety of real-world situations. The logistic regression model is highly well-liked for this reason.
It is one of the most typical queries pertaining to logistic regression. Like all other regressions, logistic regression uses predictive analysis to describe the relationship between the variables. There are numerous real-world instances of logistic regression, like the likelihood of forecasting a heart attack and determining if a transaction will succeed.
Using the Maximum Likelihood Method
Another strategy is to use maximum likelihood estimation to identify the model that maximises the probability of witnessing the data (MLE).
It turns out that maximising the Log-Likelihood is the same as minimising the Log-Loss. Finding the parameter values that maximise the following is the objective.
∑(y*log(p) + (1-y)*log(1-p))
In order to do this, we must differentiate the Log-Likelihood with respect to the parameters, set the derivatives to 0, and then solve the equation to obtain the parameter estimations.
Logistic Regression Model
You must estimate the logistic regression algorithm's coefficients (Beta values b) using the training set of data. Maximum-likelihood estimate is used for this.
Although it does make assumptions about the distribution of your data, the most prevalent learning technique utilised by many machine learning algorithms
is maximum-likelihood estimation (more on this when we talk about preparing your data).
For the default class, a model with the best coefficients would predict a value extremely close to 1 (for example, male), and for the other class, a value very close to 0 (for example, female). The idea behind maximum-likelihood logistic regression is that a search process looks for coefficient values (also known as "Beta values") that minimise the difference between the probabilities predicted by the model and those in the data (e.g. probability of 1 if the data is the primary class).
We won't get into the mathematics of greatest likelihood. It suffices to state that the ideal coefficient values for your training data are optimised using a minimization approach. The use of effective numerical optimization algorithms is frequently put into practise for this (like the Quasi-newton method).
You can build logistic yourself from scratch when studying it using the more easier gradient descent approach.
Linear regression vs logistic regression
One of the most widely used models in data science is linear regression, and open-source programmes like Python and R make calculation for these models cheap and simple.
To determine the relationship between a continuous dependent variable and one or more independent variables, linear regression models are used. Simple linear regression is used when there are only one independent variable and one dependent variable; multiple linear regression is used when there are more independent variables. Using the least squares method, each type of linear regression attempts to plot the line that best fits a given set of data points.
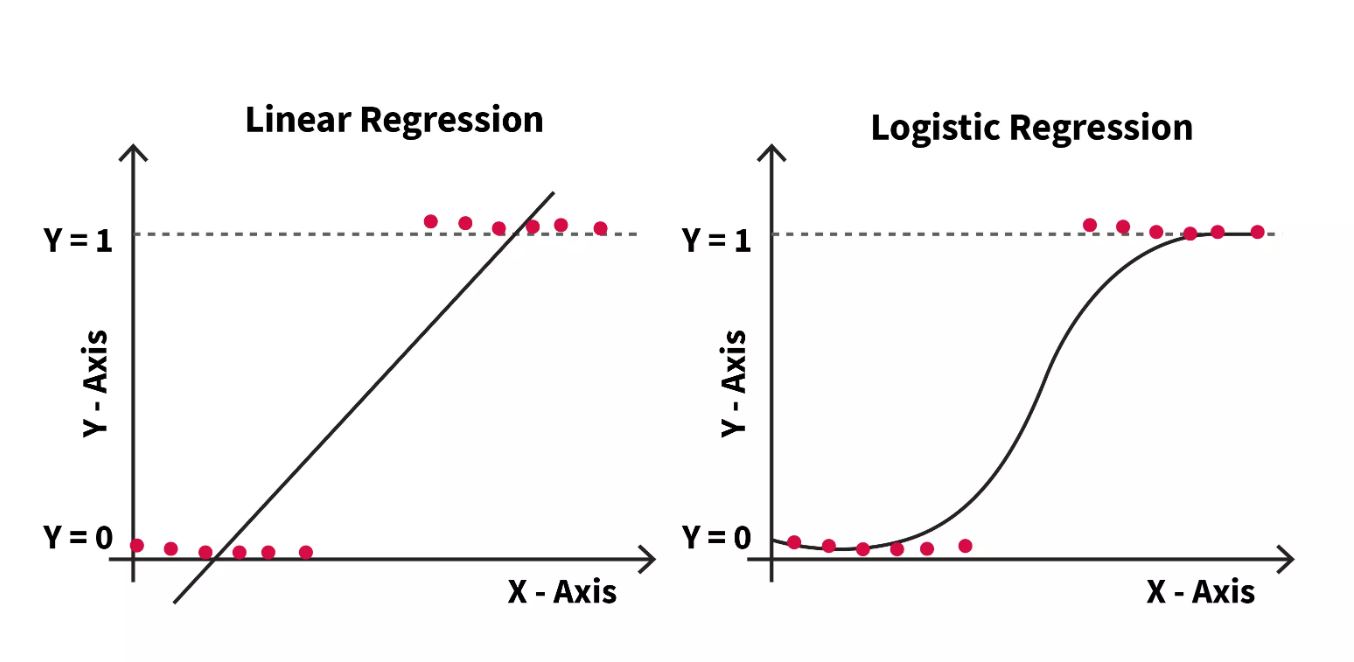
Similar to linear regression, logistic regression makes predictions about categorical variables as opposed to continuous ones. It is used to evaluate the connection between a dependent variable and one or more independent variables. A categorical variable may have the values true, false, yes, no, 1, 0, etc. The logit function turns the S-curve into a straight line, whereas linear regression creates a probability as the unit of measurement.

Although regression analysis uses both models to predict future events, linear regression is often simpler to comprehend. Additionally, logistic regression requires a sufficient sample size to adequately reflect values across all response categories, whereas linear regression does not. The model might not have sufficient s tatistical power to identify a significant effect in the absence of a larger, representative sample.
Use Cases
For problems involving categorization and prediction, logistic regression is frequently utilised. Some examples of these use cases are:
Fraud detection: Teams can find data anomalies that are indicative of fraud by using logistic regression models. In order to better safeguard their customers, banking and other financial organisations may find that certain behaviours or attributes are more frequently associated with fraudulent operations. In order to remove false user accounts from their datasets when conducting data analysis on company performance, SaaS-based organisations have also started to use these methods.
Churn prediction: In various organisational functions, particular actions may be a sign of churn. If strong performers are at risk of leaving the firm, for instance, human resources and management teams may be interested in finding out. This type of information might spark discussions about the company's culture or pay practises. As an alternative, the sales team would want to find out which of its customers might decide to do business elsewhere. In order to prevent income loss, this may inspire teams to develop a retention plan.
In medicine, this analytics strategy can be used to forecast the likelihood of a certain population developing a disease or condition. Healthcare institutions can set up preventative treatment for people who have a higher risk of developing a particular ailment.
Why can't logistic regression be used for binary classification instead of linear regression?
Following are some reasons why binary classification does not lend itself to the application of linear regressions:
Data distribution varies between logistic and linear regression in terms of the distribution of error terms. Error terms are assumed to be regularly distributed
in linear regression. This presumption is false when it comes to binary classification.
Model output: The output in a linear regression is continuous. An output of a continuous value in a binary classification situation is meaningless. In situations involving binary classification, linear regression may forecast outcomes other than 0 and 1. Its range should be limited to 0 and 1 if we want the output to take the form of probabilities that can be transferred to two separate classes. It is favoured over linear regression because the logistic regression model can produce probabilities with a logistic/sigmoid function.
Linear regression makes the assumption that the variance of residual errors is constant. The use of logistic regression also betrays this supposition.
Alternative questions can be, "Logistic regression error values are regularly distributed. specify whether it is true or false? or "Choose the incorrect logistic regression statement?"
A straight line is used in the linear regression model to calculate the association between two variables, one dependent and one independent. Given that there are two variables at play, linear regression is useful in predicting the value of one variable based on the value of another. The forecast made by linear regression gives the investigation a precise, scientific depth.
How do categorical variables fare in logistic regression?
A logistic regression model requires numeric inputs. Categorical variables cannot be handled directly by the method. Therefore, they must be transformed into a format that the algorithm can understand. A distinct numerical value known as the dummy variable will be assigned to each level of a categorical variable. The logistic regression model treats these dummy variables just like any other numerical value.
Which algorithm, SVM or logistic regression, handles outliers better?
If there is a linear border that can accept the outliers, logistic regression will locate it. The linear border will be shifted by logistic regression to account for the outliers. SVM is unaffected by particular samples. The linear border won't significantly change to make room for an outlier. Overfitting is handled via SVM's built-in complexity controls. In the case of logistic regression, this is not accurate.
Why cannot logistic regression employ Mean Square Error (MSE) as a cost function?
To determine the probabilities in logistic regression, we conduct a non-linear transformation on the sigmoid function. This non-linear transformation can be squared to provide non-convexity with nearby minimums. Gradient descent cannot be used in such situations to find the global minimum. This makes MSE inappropriate for logistic regression. Log loss or cross-entropy are utilised as the cost function in logistic regression. The cost function for logistic regression severely penalises the confidently incorrect predictions. Less money is awarded for confidently accurate predictions. This cost function can be optimised to obtain convergence.
Steps involved in logistic regression
It is a general framework that we must adhere to when creating our machine learning models for logical regression. The steps we'll take are described below:
1. Import the required libraries
2. Read and understand the data
3. Exploratory Data Analysis
4. Data Preparation
5. Building Logistic Regression Model
6. Making Predictions on Test Set
7. Assigning Scores as per predicted probability values
Import the necessary libraries: First, we import the necessary libraries.
    import numpy as nm
    import matplotlib.pyplot as mtp
    import pandas as pd


    d_set= pd.read_csv('data.csv')
Read and comprehend the data: We load the data set into the lead df data frame in pandas, which is used for additional analysis and model construction. There are 9240 rows and 37 columns in the data set. Our target variable is formed by converted column.
Exploratory Data Analysis: The data needs to be cleaned up a lot because 17 columns contain null values. If the percentage of null values in a given column is greater than 30%, that column is dropped. Otherwise, the null values are imputed using the median and mode at the relevant locations. Columns that are unnecessary or don't seem statistically significant are removed. Finally, 14 columns have been added to clear up our data.
from sklearn.model_selection import train_test_split
x1_train, x1_test, y1_train, y1_test= train_test_split(x1, y1, test_size= 0.25, random_state=0)
Data Preparation: Many variables have yes/no binary response options. We build dummy variables (one-hot encoded) for the remaining categorical categories and transform the yes/no variables to 0/1.
Building a Logistic Regression Model: When we first developed the model, we included all the variables, but we soon discovered that many of them were inconsequential (have high p-value). The number of variables needs to be decreased.
from sklearn.preprocessing import StandardScaler
std_x= StandardScaler()
x1_train= std_x.fit_transform(x1_train)
x1_test= std_x.transform(x1_test)
Test for Result Accuracy
We put up the dataset, trained it, and observed that it accurately predicted the outcome. But are these outcomes reliable? What extent do they have? We will develop a confusion matrix in order to evaluate the accuracy of our classifier. This is merely a summary of the predictions made in relation to a classification challenge.
The confusion matrix function from sklearn.metrics will first be imported, and then the function will be assigned to the confusion m variable. A new confusion matrix will be produced as a result.
from sklearn.metrics import confusion_matrix
confusion_m= confusion_matrix()
Advantages of using logistic regression
⮞ A logistic regression machine learning algorithm is simpler to employ. Logistic regression is a technique that works well for training machine learning models since it is simple to use and uses little computing power.
⮞ It accepts a number of strategies when working with large dimensional datasets, such as employing L1 and L2 techniques to stop the dataset from overfitting during training.
⮞ When applied to datasets that can be linearly separated, logistic regression works and performs well, making it a useful tool for machine learning.
⮞ It offers both positive and negative orientations, and the predictor generated is evaluated for relevance (coefficient size). It assists in supplying interferences that highlight the significance of the features by the parameters.
⮞ When you want the models to reflect new data, you may quickly update them. To get the desired outcome, you can employ techniques like stochastic gradient descent.
⮞ Their outputs from using logistic regression have improved probability and correspond well with the categorization outcomes.
⮞ It functions well with neural networks, particularly when neural classifiers are stacked.
⮞ In comparison to other methods like artificial neural networks, it requires less training time, or minimal time during the interpretation.
⮞ Using classifiers like softmax, you can expand the algorithms to accommodate multi-class classification.
⮞ After the models have been trained using logistic regressions, it is simpler to understand the output weights.
Disadvantages of using logistic regression
⮞ Since it is difficult to locate non-linear data that requires numerous features to convert the data into linear dimensions, it does not handle non-linear situations.
⮞ Working with high dimensional models could lead to inaccurate probability results. It comes as a result of situations when people train and model with little data but many features.
⮞ Due to the lack of multicollinearity between the variables, repetition might happen when training independent variables, leading to erroneous training parameters.
⮞ The log odds (log(p/(1-p)) formula must be employed to establish a linear relationship between all the variables utilised in logistic regression, both for the dependent and independent variables.
⮞ Large datasets and category examples should be provided by users for use in identification.
⮞ Outliers, or instances where the data values deviate from the predicted ranges, might produce inaccurate conclusions.
⮞ Each category should have a different set of training examples. Because the model places too much emphasis on particular training examples, you are more likely to receive duplicate results when you have related examples.
⮞ It can be challenging to employ them while dealing with complicated relationships.
Conclusions
This concludes our discussion of "Logistic Regression in Machine learning." I sincerely hope that you learned something from it and that it improved your knowledge. You can consult the ML Tutorial if you want to learn more about Machine learning.
Good luck and happy learning!


