Unlock the complete
Logicmojo experience for FREE
Sign Up Using
1 Million +
Strong Tech Community
500 +
Questions to Practice
100 +
Expert Interview Guides
Sign Up Using
Strong Tech Community
Questions to Practice
Expert Interview Guides

In the realm of statistical analysis, hypothesis testing emerges as a quintessential apparatus empowering researchers to derive compelling conclusions and engender meaningful inferences regarding populations, solely relying on the crumbly foundation of sample data. By virtue of its systematic and methodical approach, hypothesis testing assumes the role of an arbiter, judiciously evaluating the veracity of claims or hypotheses pertaining to the population parameters, diligently scrutinizing the evidential fabric woven by the sample data.
The primary objective of this article endeavors to embark upon a comprehensive expedition, unfurling the intricacies of hypothesis testing, delineating its procedural underpinnings, unraveling the tapestry of common statistical tests, elucidating the nuanced art of result interpretation, and delving into its pragmatic applications that span the breadth and scope of the English language.
 Learn More️
Hypothesis testing stands as a pivotal tool in the realm of statistical analysis, empowering researchers to derive meaningful conclusions and make informed inferences from collected data. This robust technique plays a critical role in addressing queries concerning population parameters, such as means or proportions, while simultaneously evaluating the validity of claims and theories. By embracing hypothesis testing, researchers can confidently steer their decision-making process based on data and gauge the significance of their findings.
Prior to executing the hypothesis test, the null hypothesis and an alternative hypothesis are generated. This aids in drawing an inference concerning the population of the sample taken.
Using sample data, hypothesis testing is done to determine whether a claim is plausible. These data could originate from a broader population or a process that creates data. In the descriptions that follow, "population" will be used to refer to both of these situations.
To make insightful inferences about the population's probability distribution, hypothesis testing makes use of sample data from the population. Utilizing several approaches for testing hypotheses, it examines a data assumption. The outcome of the hypothesis test is whether or not the null hypothesis is rejected.
Hypothesis testing is essential for several reasons: Objective Decision Making: Hypothesis testing provides a systematic and objective approach to decision making in research. It allows researchers to determine the validity of their claims or theories based on empirical evidence rather than subjective opinions.
Generalizability: By drawing conclusions about a population based on sample data, hypothesis testing enables researchers to make inferences that extend beyond the specific individuals or objects included in the sample. This allows for broader generalizations and insights into the population of interest.
Data-Driven Decision Making: Hypothesis testing facilitates data-driven decision making by providing a structured approach to evaluate the evidence in support of or against a hypothesis. It helps researchers base their conclusions on objective analysis rather than personal biases or intuition.
Scientific Rigor: Hypothesis testing is an integral part of the scientific method. It adds rigor and objectivity to research by providing a formal process for testing and validating hypotheses. It ensures that conclusions are supported by empirical evidence and can be replicated and verified by other researchers.
To show that the null hypothesis is plausible, an analyst tests the null hypothesis using a statistical sample. To test a theory, measurements and analysis are performed on a randomly chosen sample of the population. Researchers test the null and alternative hypotheses using a random population sample. The null hypothesis often asserts that two population parameters are identical; for instance, it can assert that the population means return is equal to zero. The alternative hypothesis is, in essence, the opposite of the null hypothesis (for instance, the population indicates that the return is not zero). They therefore conflict with one another, and only one of them can be true. However, one of the two options will always be true.
Learn From Basic to Advanced Data Structures, Algorithms & Problem-Solving techniques in Java

1:1 Mentorship
4 Months Classes
LIVE Classes Weekend
Projects included

Learn From Basic to Advanced DSA, Problem Solving, Scalable System Design (HLD + LLD),Design Patten in Java
1:1 Mentorship
7 Months Classes
LIVE Classes Weekend
Projects included
Now we will look into more questions related to Hypothesis Testing to know about differents types and its applications and many more things.
In hypothesis testing, two competing hypotheses are formulated: the null hypothesis (H0) and the alternative hypothesis (H1). These hypotheses represent different positions or claims about the population under investigation.
The null hypothesis postulates an absence of significant disparity or impact within the population. It embodies the prevailing status quo or default stance until compelling evidence suggests otherwise. In essence, it assumes that any observed distinctions or effects in the sample data stem from mere happenstance or the vagaries of sampling. The null hypothesis is commonly denoted as H0.
The aim of hypothesis testing resides in appraising the evidence furnished by the gathered data and rendering a verdict concerning the null hypothesis. The decision is either to reject the null hypothesis or abstain from rejecting it. If the evidence exhibits considerable strength, the null hypothesis is dismissed in favor of the alternative hypothesis.here are two methods for gathering data in practice. Finding and assembling the data you need for the analyses is the first step.
The alternative hypothesis contradicts the null hypothesis and posits a precise divergence or impact within the population. It represents the researcher's claim or theory and often embodies their aspirations for substantiation through data analysis. The alternative hypothesis is designated as H1.
The formulation of the alternative hypothesis hinges upon the researcher's expectations or the specific hypothesis being examined. It proposes that the observed disparities or effects in the sample data arise not from mere happenstance, but rather as a consequence of a particular factor or condition under investigation. The alternative hypothesis offers an alternate explanation or theory to challenge the null hypothesis.
The decision pertaining to the null and alternative hypotheses is forged based on the evidence derived from data analysis. This evidence is evaluated using statistical techniques to gauge the likelihood of observing the obtained results under the null hypothesis assumption. If the evidence vigorously contradicts the null hypothesis, it lends support to the alternative hypothesis, leading to its acceptance.
Hypothesis testing involves several steps that guide researchers through the process of analyzing the collected data and drawing valid conclusions. These steps include formulating the hypotheses, choosing the significance level, collecting and analyzing data, calculating the test statistic, and interpreting the results.
In order to conduct a quantitative test of your original research hypothesis, it is essential to reformulate it as a null (Ho) and alternative (H1) hypothesis first. Your original research hypothesis is the prediction that you desire to examine. Your first hypothesis, the one that predicts a link between variables, is almost always going to be your alternate hypothesis. The assumption that there is no connection between the variables of interest is known as the null hypothesis.
If you want your statistical test to be taken seriously, you need to make sure that the sampling and data collection processes are carried out in a way that is designed to put your hypothesis to the test. If your data is not representative of the population you are interested in studying, you will be unable to draw any statistical inferences about that population.
There are a variety of alternative statistical tests available, but they all compare the within-group variance (the degree to which the data are dispersed within a category) to the between-group variance (the degree to which the categories differ from one another). In the event that the between-group variation is sufficiently large such that there is little to no overlap between the groups, the p-value that your statistical test displays to indicate this occurrence will be low.
This lends credence to the idea that the differences between these groups are highly unlikely to have arisen as a result of random chance. If, on the other hand, there is a huge variance within the group but a low variance between the groups, the results of your statistical test will indicate a high p-value. Any variation between the groups that you discover is almost certainly due to random occurrences. Your choice of statistical test will be affected by the number of different variables as well as the level of measurement involved in your data collection.
The findings of your statistical test need to indicate whether or not your null hypothesis should be rejected. Your conclusion will almost always be predicated on the p-value that is derived from the statistical test. Your predetermined level of significance for rejecting the null hypothesis will almost always be set at 0.05. This means that you will do so when there is less than a 5% possibility that these data would be seen if the null hypothesis were correct. In other contexts, researchers will use a lesser level of significance, such as 0.01 (1%), to evaluate their findings. Because of this, the likelihood of incorrectly rejecting the null hypothesis is decreased.
In the sections of your research paper, dissertation, or thesis devoted to results and discussion, you will discuss the findings that were obtained from testing the hypothesis. In the section under "Results," you want to incorporate a succinct overview of the data as well as a summary of the outcomes of your statistical test. During the dialogue, you are free to discuss whether or not the outcomes of your experiment confirmed your original premise. In the context of hypothesis testing, the terms "rejecting" and "failing to reject" the null hypothesis are both formal terms. This is most likely required for the statistical assignments you have upcoming.
The p-value is a crucial factor in the evaluation of the evidence against the null hypothesis and the determination of whether it should be accepted or rejected during hypothesis testing. The p-value serves as a gauge of how strongly the data argue against the null hypothesis. If the null hypothesis is true, it shows the likelihood of getting the observed outcomes or more severe results.
The threshold for rejecting the null hypothesis is determined by the researcher while doing hypothesis testing, and is sometimes denoted as (alpha). The common thresholds for significance are 0.05 (5%) and 0.01 (1%). The desired level of confidence and the effects of Type I and Type II errors influence the choice of significance level.
The estimated p-value is compared to the significance level following data analysis. There are three potential outcomes:
1. If the p-value is less than the threshold for significance (p < α): This shows that if the null hypothesis is correct, the observed outcomes are very improbable to occur. In other words, the null hypothesis is strongly refuted by the facts. It implies that random chance or sampling variability are improbable causes of the observed differences or effects in the sample data. As a result, the alternative hypothesis is accepted and the null hypothesis is rejected.
2. If the p-value exceeds the level of significance (p ≥ α): This shows that even if the null hypothesis is correct, the observed results are still likely to occur. In this instance, the evidence is insufficient to rule out the null hypothesis. The alternative hypothesis is not strongly supported by the facts, and the null hypothesis is not disproved.
3. If the p-value is the same as the level of significance (p = α): It's common to refer to this situation as a borderline case. The specific rules or procedures that the researcher adheres to determine whether to accept or reject the null hypothesis. When assessing borderline p-values, it's crucial to take into account the situation, the size of the observed effect, and other pertinent aspects.
It is essential to realize that a p-value does not directly reflect the strength or size of an effect. It merely evaluates how strong the evidence is in opposition to the null hypothesis. A big p-value does not necessarily mean no effect, and a small p-value does not necessarily imply a substantial or practically important effect. The p-value tells us how likely it is that the data will be observed if the null hypothesis is true.
The rejection of the null hypothesis is frequently coupled with outcomes that are statistically significant (p ). However, it's critical to consider the precise study topic at hand as well as the size of the effect that was actually seen when interpreting statistical significance. Practical or real-world relevance cannot always be determined only by statistical significance. When interpreting the findings of hypothesis testing, researchers should additionally take into account effect sizes, practical implications, and other contextual considerations.
In conclusion, the p-value in hypothesis testing is a measurement of the evidence against the null hypothesis. Strong evidence to reject the null hypothesis in favor of the alternative hypothesis is indicated by a p-value that is less than the significance level. To make relevant and well-informed decisions, it's crucial to understand the p-value in conjunction with other variables.
In hypothesis testing, various statistical tests are utilized depending on the type of data and the research question at hand. Understanding these tests is crucial for selecting the appropriate analysis technique. Here are explanations of some commonly used statistical tests:
The t-test is used to compare the means of two groups in order to ascertain whether or not there is a statistically significant difference between the groups. It is especially helpful in situations when the sample size is quite small or where the standard deviation of the population is unknown. The two most common varieties of t-tests are as follows:
Independent Samples t-test: This test compares the means of two independent groups or samples. It assesses if there is a significant difference in the means between the two groups.
The formula for the independent samples t-test is:
Paired Samples t-test: This test compares the means of two related samples or groups that are measured at two different time points or conditions. It assesses if there is a significant difference in the means before and after the intervention.
The formula for the paired samples t-test is:
The z-test is similar to the t-test but is used when the population standard deviation is known or when the sample size is large. It compares means between two groups and determines whether the difference is significant. The z-test is based on the standard normal distribution.
The formula for the z-test is:
Analysis of Variance (ANOVA) is a statistical test used to compare means across three or more groups. It examines whether there are statistically significant differences between the means of these groups. ANOVA partitions the total variation into components attributed to different sources, such as between-group variation and within-group variation.
The formula for one-way ANOVA is:
The chi-square test is widely employed to analyze categorical data and determine if the observed distribution significantly differs from the expected distribution. It is particularly useful for testing relationships and associations between categorical variables.
The formula for the chi-square test depends on the specific test being conducted, such as the chi-square test of independence or the chi-square goodness-of-fit test. These formulas provide a general understanding of how the statistical tests are calculated. However, the actual computation may vary depending on the specific software or statistical package used for analysis.
It's important to consult appropriate resources or statistical guides for precise calculations and interpretations of the results when conducting hypothesis testing using these tests.
Both hypothesis testing and the use of confidence intervals are examples of inferential approaches that rely on providing an approximation of the sample distribution. Using confidence intervals, an estimate of a parameter for a population can be derived from data obtained from a sample. In order to examine a certain hypothesis, hypothesis testing makes use of the data obtained from a sample. In order to test the hypothesis, we will need a posited parameter.
Both bootstrap distributions and randomization distributions can be generated through simulation utilizing methods that are analogous to one another. The value of the null hypothesis is considered to be the focal point of a randomization distribution, whereas the observed sample statistic is considered to be the focal point of a bootstrap distribution.
Estimates of a number of different population parameters that are both realistic and practical are incorporated into confidence ranges. Only confidence intervals with two tails were constructed during this particular lesson. These two-tail hypothesis tests and these two-tail confidence intervals are inextricably linked to one another and have a direct connection. In most cases, the outcomes of a test of the hypothesis with two possible outcomes and confidence intervals with two possible outcomes produce the same findings. To put it another way, if the confidence interval for 95% encompasses the value that was predicted, a hypothesis test performed at the 0.05 level of significance will almost never succeed in rejecting the null hypothesis. A hypothesis test performed at a significance level of 0.05 will reject the null hypothesis with an almost absolute certainty if the 95% confidence interval does not include the hypothesized parameter.
Testing a hypothesis can be broken down into a few distinct categories, each of which is determined by the specifics of the research question and the particulars of the data that is being studied. For the purpose of selecting the suitable method of statistical analysis, having a solid understanding of these many kinds of tests is essential.
The following is an explanation of a few of the most frequent types of hypothesis tests:
A one-sample test compares the mean or proportion of a single sample to a known population parameter or a hypothesized value. It is used when researchers want to determine if the sample is significantly different from a specific value. The test examines whether the sample provides evidence to support or reject the hypothesis about the population parameter. Examples of one-sample tests include:
• One-Sample t-Test: Compares the mean of a sample to a known or hypothesized population mean.
• One-Sample Proportion Test: Compares the proportion of a categorical outcome in a sample to a known or hypothesized population proportion.
A two-sample test compares the means or proportions of two independent samples to assess if they are significantly different from each other. It helps evaluate whether there is a significant association or difference between two groups. The test determines whether the observed differences are due to random chance or if they are statistically significant. Examples of two-sample tests include:
• Independent Samples t-Test: Compares the means of two independent groups or samples.
• Independent Samples Proportion Test: Compares the proportions of a categorical outcome in two independent groups or samples.
A paired test, also known as a dependent or matched-pairs test, compares two related samples. It is used when each observation in one sample is matched or paired with a corresponding observation in the other sample, such as before-and-after measurements. The test examines whether there is a significant difference between the paired observations. Examples of paired tests include:
• Paired t-Test: Compares the means of paired observations within the same subjects or units.
• McNemar's Test: Compares the proportions of a categorical outcome in paired observations.
These different types of hypothesis tests allow researchers to examine various research questions and make statistically informed conclusions. By selecting the appropriate test based on the nature of the data and the research question, researchers can analyze their data and gain insights into the relationships and differences present in the population of interest.
In hypothesis testing, the choice between a left-tailed or right-tailed test depends on the specific research question and the direction of the effect or difference being investigated. These two types of tests allow researchers to examine whether the data provides evidence of an effect in a particular direction.
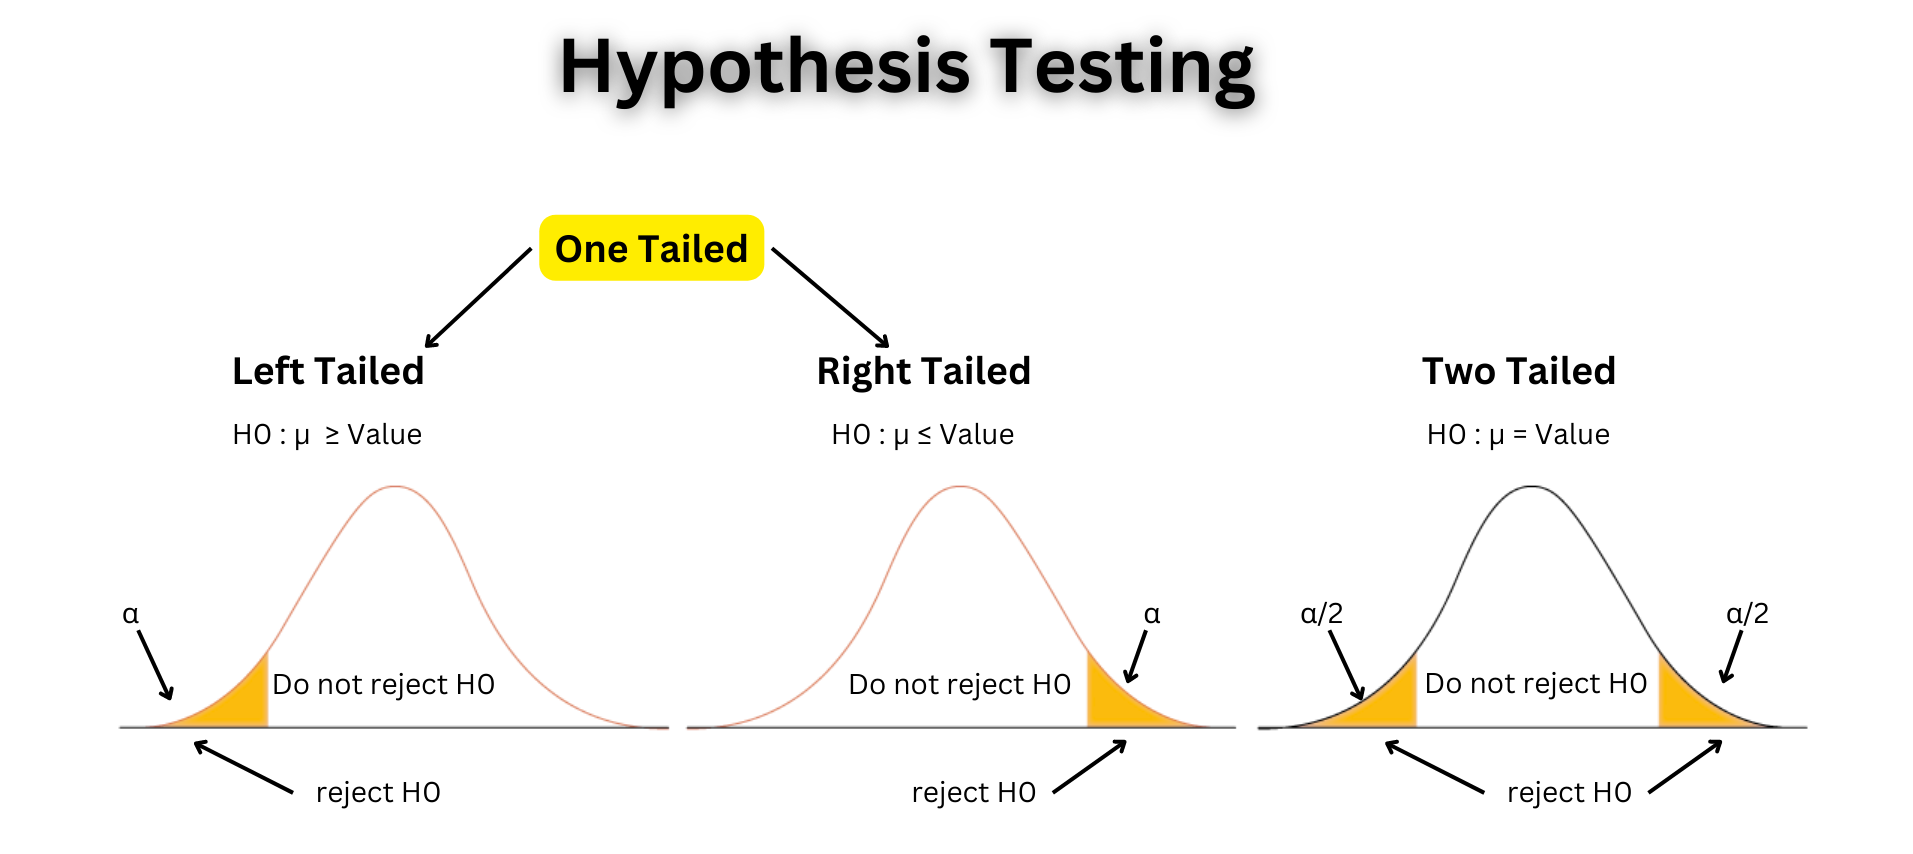
In a test known as a left-tailed test, the alternative hypothesis concentrates on determining whether or not there is a significant effect or difference in the distribution's left tail. When the research question or hypothesis is explicitly interested in establishing whether the observed data is significantly smaller or lower than the expectation of the null hypothesis, it is appropriate to utilize this method
•For instance, if the alternative hypothesis (H1) to the null hypothesis (H0) suggests that there is no difference or effect, the left-tailed alternative hypothesis (H1) would imply that the effect is much less significant or lower than the expectation derived from the null hypothesis.
The critical region, where the observed test statistic must fall to reject the null hypothesis, is located in the left tail of the distribution. The p-value represents the probability of obtaining a test statistic as extreme as, or more extreme than, the observed value, assuming the null hypothesis is true.
In a right-tailed test, the alternative hypothesis focuses on detecting a significant effect or difference in the right tail of the distribution. It is used when the research question or hypothesis is specifically interested in determining if the observed data is significantly larger or higher than the null hypothesis expectation. Continuing with the example of the null hypothesis (H0) stating no difference or effect, the right-tailed alternative hypothesis (H1) would suggest that the effect is significantly larger or higher than the null hypothesis expectation.
The critical region, where the observed test statistic must fall to reject the null hypothesis, is located in the right tail of the distribution. The p-value represents the probability of obtaining a test statistic as extreme as, or more extreme than, the observed value, assuming the null hypothesis is true.
When formulating hypotheses and choosing the appropriate test, it is essential to consider the research question, the expected direction of the effect or difference, and the nature of the data being analyzed. Selecting the correct type of hypothesis test is crucial for making accurate inferences and drawing meaningful conclusions from the data.
In summary, left-tailed and right-tailed hypothesis testing allow researchers to examine the evidence for an effect or difference in a specific direction. The choice between these tests depends on the research question and the expected direction of the effect. By formulating the appropriate hypotheses and selecting the correct test, researchers can assess the statistical significance of their findings and gain insights into the underlying phenomena.
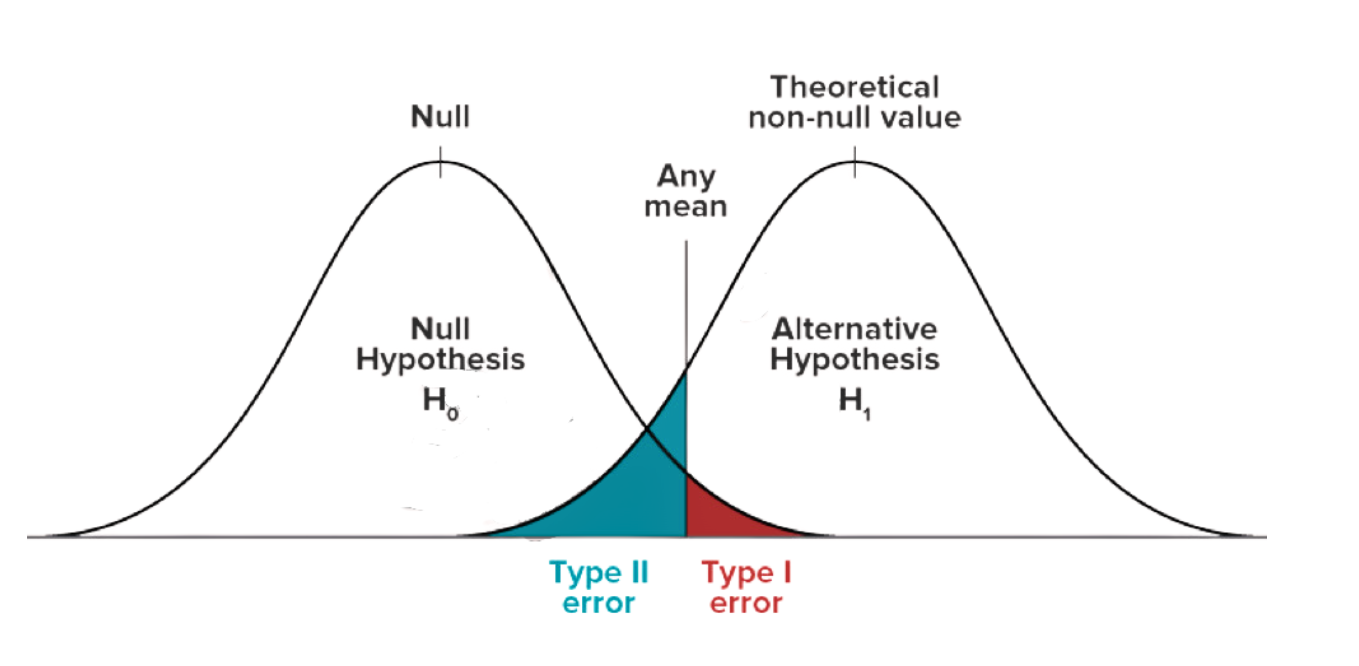
Hypothesis testing involves the possibility of making two types of errors: Type I and Type II errors. Understanding these errors is crucial for interpreting the results of hypothesis tests accurately.
A Type I error occurs when the null hypothesis is incorrectly rejected, suggesting a significant difference or effect when none exists in the population. It represents a false positive result, as the researcher concludes that there is a significant effect or difference based on the sample data, even though it is due to random chance or sampling variability.
The probability of committing a Type I error is denoted by the significance level (α). Commonly used significance levels are 0.05 (5%) and 0.01 (1%). By setting a significance level, researchers determine the threshold beyond which they consider the evidence against the null hypothesis to be strong enough to reject it.
• Example of Type I Error:
Let's consider a medical study testing the effectiveness of a new drug. The null hypothesis (H0) states that the new drug has no effect, while the alternative hypothesis (H1) states that the new drug is effective. A Type I error occurs if the study concludes that the new drug is effective (rejecting the null hypothesis) when, in fact, it has no effect.
If the significance level is set at 0.05, it means that there is a 5% chance of committing a Type I error. In other words, 5% of the time, researchers would mistakenly conclude that the drug is effective when it is not.
A Type II error occurs when the null hypothesis is incorrectly not rejected, failing to detect a significant difference or effect that actually exists in the population. It represents a false negative result, as the researcher fails to conclude that there is a significant effect or difference based on the sample data, even though it truly exists in the population.
The probability of committing a Type II error is denoted by the Greek letter beta (β). It depends on various factors, including the sample size, effect size, and the chosen significance level (α). As the sample size increases or the effect size becomes larger, the probability of committing a Type II error decreases.
• Example of Type II Error:
Continuing with the medical study example, a Type II error would occur if the study fails to conclude that the new drug is effective (fails to reject the null hypothesis) when, in reality, it does have a significant effect.
For instance, suppose the new drug truly has a beneficial effect on patients, but the study fails to detect this effect due to a small sample size or insufficient statistical power. In such cases, a Type II error would occur, leading to the false conclusion that the drug is not effective.
In hypothesis testing, there is a trade-off between Type I and Type II errors. Decreasing the significance level (α) to reduce the chance of a Type I error increases the chance of a Type II error. Conversely, increasing the significance level to decrease the chance of a Type II error increases the chance of a Type I error.
Researchers should carefully consider the consequences of both types of errors, the context of the study, and the goals of the research when selecting the appropriate significance level. They need to strike a balance between minimizing the risks of both types of errors to make valid and reliable conclusions.
In summary, Type I error occurs when the null hypothesis is incorrectly rejected, and Type II error occurs when the null hypothesis is incorrectly not rejected. Both errors have implications for the validity of research findings, and researchers must carefully consider them when interpreting the results of hypothesis tests.
A key consideration in hypothesis testing is sample size because it directly affects the test's statistical power and the precision and dependability of its findings. The right sample size must be chosen in order to draw findings that are reliable and relevant. The significance of sample size in hypothesis testing is explained in more depth below:
The chance of accurately rejecting the null hypothesis when it is wrong is referred to as statistical power. In other words, it refers to a test's capacity to identify an actual difference or effect in the population. A greater sample size boosts the test's statistical power, increasing its ability to identify real differences or effects.
A greater sample size increases the likelihood that the test will accurately represent the population's underlying features, minimizing the influence of random variation and improving the accuracy of the estimations. Researchers are now able to spot any potential small effects or variations because to this improved power.
When the null hypothesis is wrongly not rejected and a significant impact or difference that actually exists in the population is not found, type II error has occurred. Due to decreased test power, a small sample size might raise the likelihood of making a Type II error.
With a tiny sample size, the test might not be sensitive enough to pick up on mild or subtle effects. As a result, the study can miss out on important differences or effects, producing false conclusions. The risk of Type II errors can be reduced and the possibility of identifying real effects can be increased by making sure the sample size is adequate.
The population's representation is adequate.
A bigger sample size aids in producing a sample that more closely resembles the population's characteristics. The generalizability of the results is improved and sampling bias is reduced by using a representative sample. Based on the observed sample, it enables researchers to make solid deductions about the larger population.
A small sample size may not adequately represent the population's diversity and variability, producing estimates with limited generalizability. A greater sample size increases the study's external validity since it increases the likelihood that the sample will be sufficiently representative of the population.
The precision of the calculations and the width of the confidence intervals are influenced by sample size. A greater sample size results in narrower confidence intervals, which gives estimates of the population parameters that are more accurate. A higher degree of confidence in the estimated effect or difference is shown by narrow confidence intervals.
Small sample sizes typically lead to less accurate estimates and broader confidence ranges. More uncertainty is introduced by these broader intervals, which also lowers the degree of confidence in the estimated effect. By boosting the sample size, scientists can get more accurate estimations and improve the accuracy of their conclusions.
From an ethical perspective, picking the right sample size is crucial. A participant's burden and risk must be kept to a minimum in research involving human subjects. If the sample size is too small, the study may unnecessarily subject participants to the possible dangers of involvement without producing conclusive findings.
Researchers can strike a balance between generating trustworthy results and safeguarding the welfare of study participants by choosing the right sample size based on power estimates and ethical concerns.
In conclusion, sample size is very important for evaluating hypotheses. A greater sample size boosts statistical power, lowers the chance of Type II errors, improves population representation, increases precision, and enables drawing more certain and trustworthy conclusions. To ensure the validity and generalizability of their findings, researchers should carefully assess the sample size requirements.
Hypothesis testing finds practical applications in various fields, enabling researchers to make data-driven decisions and draw meaningful conclusions. Here are detailed explanations of three practical examples of hypothesis testing in different domains:
Testing Hypotheses in Medical Research In the field of medical research, testing hypotheses is a common method used to evaluate the efficacy of new treatments or medications. Take, for instance, a study that looked at whether or not a recently developed medication was effective in lowering blood pressure. The researchers would come up with the hypothesis known as the null hypothesis (H0), which states that there is no significant difference in blood pressure between the control group (which received a placebo) and the treatment group (which received the new drug).
If the alternative hypothesis (H1) is correct, then it would imply that there is a statistically significant drop in blood pressure in the treatment group in comparison to the group that received no therapy. Researchers are able to assess whether or not a treatment has a substantial influence on lowering blood pressure by first collecting data on blood pressure readings from both groups and then running suitable statistical analyses.
In studies on marketing, the testing of hypotheses is used to evaluate the efficacy of advertising campaigns, pricing tactics, or product adjustments. For example, suppose a company introduces a new advertising campaign and wants to determine if it leads to a significant increase in sales. The null hypothesis (H0) would state that there is no significant difference in sales before and after the campaign.
The alternative hypothesis (H1) would suggest that the advertising campaign has a significant positive impact on sales. By collecting sales data before and after the campaign and conducting statistical tests, marketers can evaluate if the observed differences in sales are statistically significant and attribute them to the advertising intervention.
Hypothesis testing is essential in quality control to ensure that products meet specified standards. Manufacturers collect data from production processes to determine if there are significant differences in product quality or if adjustments need to be made. For instance, a manufacturer of packaged food products might conduct hypothesis testing to ensure consistent fill levels in their packages.
The null hypothesis (H0) would assume that there is no significant difference in the mean fill level compared to a specified target value. The alternative hypothesis (H1) would suggest that there is a significant difference. By collecting data on fill levels from a sample of packages and conducting appropriate statistical tests, manufacturers can assess if the observed differences in fill levels are statistically significant and take corrective actions if necessary.
In summary, hypothesis testing finds practical applications in diverse fields such as medical research, marketing studies, and quality control. By formulating appropriate hypotheses, collecting relevant data, and conducting statistical tests, researchers and professionals can evaluate the effectiveness of interventions, make data-driven decisions, and ensure product quality.
Hypothesis testing is a valuable tool in statistical analysis, but it is not without limitations. Understanding these limitations is crucial for interpreting the results correctly and drawing meaningful conclusions. Here are some common limitations of hypothesis testing:
Most statistical tests used in hypothesis testing rely on certain assumptions about the data, such as normality, independence, and equal variances. Violation of these assumptions can affect the validity of the test results. If the data does not meet the assumptions, the results may be unreliable or misleading. Researchers should carefully assess the assumptions of the chosen statistical test and consider alternative methods if the assumptions are violated.
Hypothesis testing is based on analyzing a sample of data to draw conclusions about a larger population. However, sampling errors can occur due to random variation. The results obtained from the sample may not perfectly reflect the true characteristics of the population. Larger sample sizes can help reduce the impact of sampling errors, but there is always some level of uncertainty associated with the findings. Researchers should be cautious when generalizing the results from the sample to the entire population.
Hypothesis testing involves the risk of making Type I and Type II errors. Type I error occurs when the null hypothesis is incorrectly rejected, while Type II error occurs when the null hypothesis is incorrectly not rejected. The choice of significance level (α) affects the balance between these two types of errors. Researchers must consider the consequences of both types of errors and strike an appropriate balance to draw valid conclusions.
Statistical significance does not always imply practical or real-world significance. Even if a hypothesis test shows a statistically significant result, the effect or difference observed may not be practically meaningful. Researchers should consider the context, effect sizes, and practical implications of the findings when interpreting the results. The importance of statistical significance should be weighed against the substantive significance to make informed decisions.
Hypothesis testing is conducted on a specific sample of data, which may not fully represent the entire population of interest. The external validity or generalizability of the findings may be limited to the specific context or population studied. Researchers should be cautious when extrapolating the results beyond the studied sample and consider the applicability of the findings in different settings or populations.
Conducting multiple hypothesis tests without appropriate adjustments can increase the risk of false positive results. The more tests conducted, the more likely it is to obtain statistically significant results by chance alone. This phenomenon is known as p-hacking, where researchers selectively report statistically significant findings without adequately accounting for multiple comparisons. Proper procedures, such as controlling the family-wise error rate or using adjusted p-values, should be employed to address this issue. In order to resolve this matter, the appropriate approaches must to be utilized, such as regulating the family-wise error rate or making use of p-values that have been corrected.
Testing a hypothesis is a fundamental notion in statistics that plays an essential part in making judgments that are supported by data and drawing meaningful conclusions about populations. It offers a method that is both methodical and scientific for evaluating hypotheses or claims by making use of sample data. Researchers are able to evaluate the relevance of their findings and contribute to the progress of knowledge in a variety of sectors by adhering to an organized procedure that includes the formulation of clear hypotheses, selection of relevant statistical tests, and interpretation of the results.
Nevertheless, when testing a hypothesis, it is absolutely necessary to take into account the constraints as well as the possible error causes. It is important to take into account the assumptions established in statistical tests, the errors that can occur during sampling, and the extent to which the results can be generalized. In addition, one should take into account the practical significance of the findings in addition to the statistical significance of the findings in order to guarantee the applicability and influence of the results in real-world scenarios.
In conclusion, hypothesis testing offers a method that is both methodical and rigorous for evaluating claims and generating conclusions based on sample data. This is because hypothesis testing is based on the null hypothesis. Researchers have the ability to make decisions based on facts, contribute to knowledge in their respective domains, and create improvements in scientific understanding if they adhere to the principles of hypothesis testing and conduct their study accordingly. It is crucial for performing meaningful research and drawing findings based on informed judgment to have a solid understanding of the procedure, constraints, and interpretation of hypothesis testing.
Hypothesis testing helps researchers evaluate whether a claim or hypothesis about a population parameter is supported by the evidence provided by the sample data. It allows for data-driven decision-making and provides a scientific approach to drawing conclusions.
The significance level, often denoted as α (alpha), determines the probability of rejecting the null hypothesis when it is true. It represents the researcher's tolerance for making a Type I error, where the null hypothesis is incorrectly rejected.
In medical research, hypothesis testing is used to determine the effectiveness of new treatments or medications. Researchers compare patient outcomes between a control group and a treatment group to evaluate if the treatment has a significant impact.
Type I error occurs when the null hypothesis is incorrectly rejected, suggesting a significant difference or effect when none exists. Type II error occurs when the null hypothesis is incorrectly not rejected, failing to detect a significant difference or effect when one exists.
Sample size is important in hypothesis testing as it affects the statistical power of the test. A larger sample size increases the likelihood of detecting true differences or effects and improves the reliability of the results.

PHONE: +91 80889-75867