Data Science Interview Questions
Every day, a vast amount of data is generated as a result of the increase in mobile users, increased internet penetration rates, and the availability of various eCommerce apps. Data science is a field of study that collects, transforms, models, and examines data in order to gain a deeper knowledge of the data. Data science is used by businesses to enhance decision-making, increase revenue, and achieve growth.
One estimate states that 1.145 trillion gigabytes of data are generated each day. Data science is employed in a wide range of industries, including healthcare, banking, retail, manufacturing, and transportation. Data science is utilized in healthcare to establish individualized treatment strategies, discover illness patterns, and enhance patient outcomes. Data science is used in finance to detect fraud, manage risk, and make investment decisions.
Data science is used in retail to personalize consumer experiences, improve inventory, and forecast demand. Data science is utilized in manufacturing to improve product quality, optimize production processes, and minimize costs. Data science is applied in transportation to enhance traffic flow, optimize routes, and reduce accidents.


And if you want to work as a data scientist, you'll need to be ready to wow potential employers with your knowledge. To do so, you'll need to ace your next data science interview in one sitting.
We have thoughtfully curated a selection of frequently encountered data science interview questions, catering to candidates at various experience levels. Our aim is to simplify the interview process, ensuring a smoother and more confident experience for all applicants.

Data Science Interview Questions and Answers

What is Data Science?
Data scientists are information technology experts whose primary duty in an organization is to perform data wrangling on vast amounts of structured and unstructured data after acquiring and analyzing it. Data scientists require this massive amount of data for a variety of purposes, including developing hypotheses, assessing market and customer patterns, and making judgments.
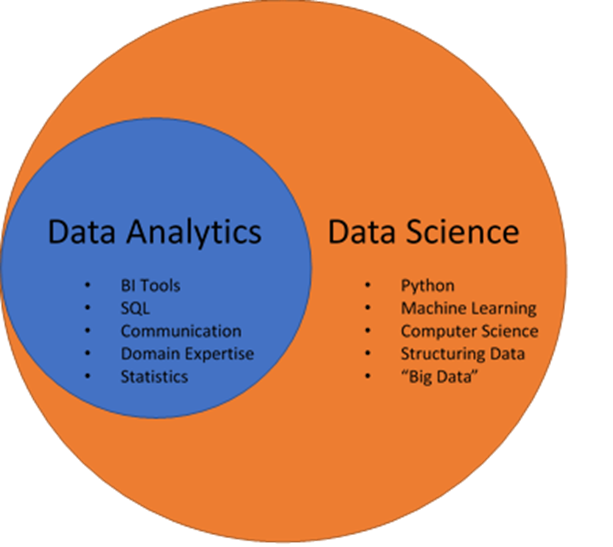
Differentiate between Data Analytics and Data Science?
• Data science entails converting data using a variety of technical
analysis approaches to derive useful insights that a data analyst can apply to their business settings.
• For a more effective and profitable business decision-making process, data analytics examines existing hypotheses and information and gives answers to queries.
• Data science encourages innovation by answering questions that allow individuals to make connections and solve problems in the future. Data analytics focuses on
extracting present meaning from historical context, whereas data science focuses on predictive modelling.
• Data science is a broad field that uses a variety of mathematical and scientific tools and methodologies to solve complex problems, whereas data analytics is a narrower
field that uses fewer statistical and visualisation tools to solve specific problems.
How do supervised and unsupervised learning differ?
| Supervised learning | Unsupervised learning |
|---|---|
| Data that has been labelled is used to train supervisory learning systems. | Unsupervised learning algorithms are taught on data that has not been labelled. |
| Direct feedback is used in the supervised learning model to check whether it is accurately expecting output. | In the unsupervised learning paradigm, there is no feedback. |
| The purpose of supervised learning is to train the model to predict the outcome when fresh data is provided. | Unsupervised learning seeks to identify hidden patterns and significant insights. |
| Classification and regression issues can be used to group supervised learning. | Unsupervised learning challenges include clustering and association problems. |
What is the definition of selection bias?
Selection bias is an error that occurs when a researcher chooses the persons who will be researched. It's frequently connected with studies where the participants aren't chosen at random. This process is referred to as the selection effect. It is the statistical analysis distortion caused by the sample collection procedure. Some of the study's conclusions may be inaccurate if the selection bias is not taken into account.
Types of selection bias:
1. Sampling bias: It is a systematic error caused by a non-random sample of a population, resulting in a skewed sample with some members of the population being less likely to be included than others.
2. Time interval: Even if all variables have a similar mean, a trial may be discontinued early if an extreme value is achieved (typically for ethical concerns), but the extreme value is most likely to be reached by the variable with the biggest variance.
3. Data: When certain groups of data are picked at random to support a conclusion or to reject faulty data, rather than according to previously declared or widely agreed-upon standards.
4. Attribution: Attrition bias is a type of selection bias that occurs when trial subjects or tests are not completed due to attrition (loss of participants).
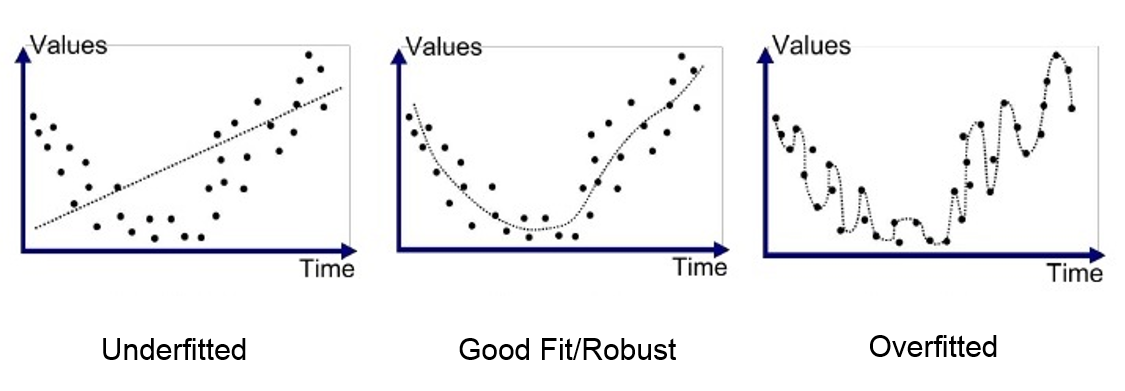
Explain the conditions overfitting and underfitting circumstances.
Overfitting: Only for the sample training data does the model function well. If the model is given new data as input, it fails to produce any results. Low bias and large variation in the model cause these situations. In decision trees, overfitting is more common.
Underfitting: The model is so simplistic in this case that it is unable to recognise the correct relationship in the data, and hence fails to perform well even on test data. Because of the large bias and low variation, this can happen. In linear regression, underfitting is more common.
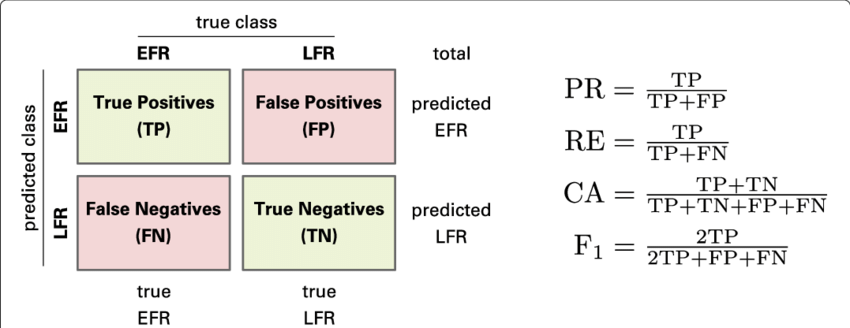
Explain confusion matrix?
The confusion matrix is a 2X2 table that contains the binary classifier's four outputs. It is used to calculate several metrics such as error rate, accuracy, specificity, sensitivity, precision, and recall. Matrix of Perplexity
It evaluates the performance of classification models when making predictions on test data and indicates how good our classification model is.
We can calculate the model's different parameters, such as accuracy and precision, using the confusion matrix.
All data occurrences in a test dataset are predicted by a binary classifier to be either positive or negative. This results in four effects:
1. True positive(TP) — It means that the positive prediction is correct.
2. False-positive(FP) — It means that the positive prediction is incorrect.
3. True negative(TN) — It means that the negative prediction is correct.
4. False-negative(FN) — It means that the negative prediction is incorrect.
Error rate (FP+FN)/(P+N), specificity (TN/N), accuracy (TP+TN)/(P+N), sensitivity (TP/P), and precision (TP/(TP+FP)) are just a few of the measurements it assists in computing.
In situations where the truth values of the experiments are already known and the target class has more than two categories of data, a confusion matrix is primarily used to assess the success of a machine learning model. It aids in the evaluation and visualization of statistical process outcomes.
What do you understand by the term Normal Distribution?
Gaussian Distribution is another name for the normal distribution. It is a particular kind of symmetric probability distribution around the mean. It demonstrates that the data are more closely correlated with the mean and that the data's frequency of occurrences are outliers.
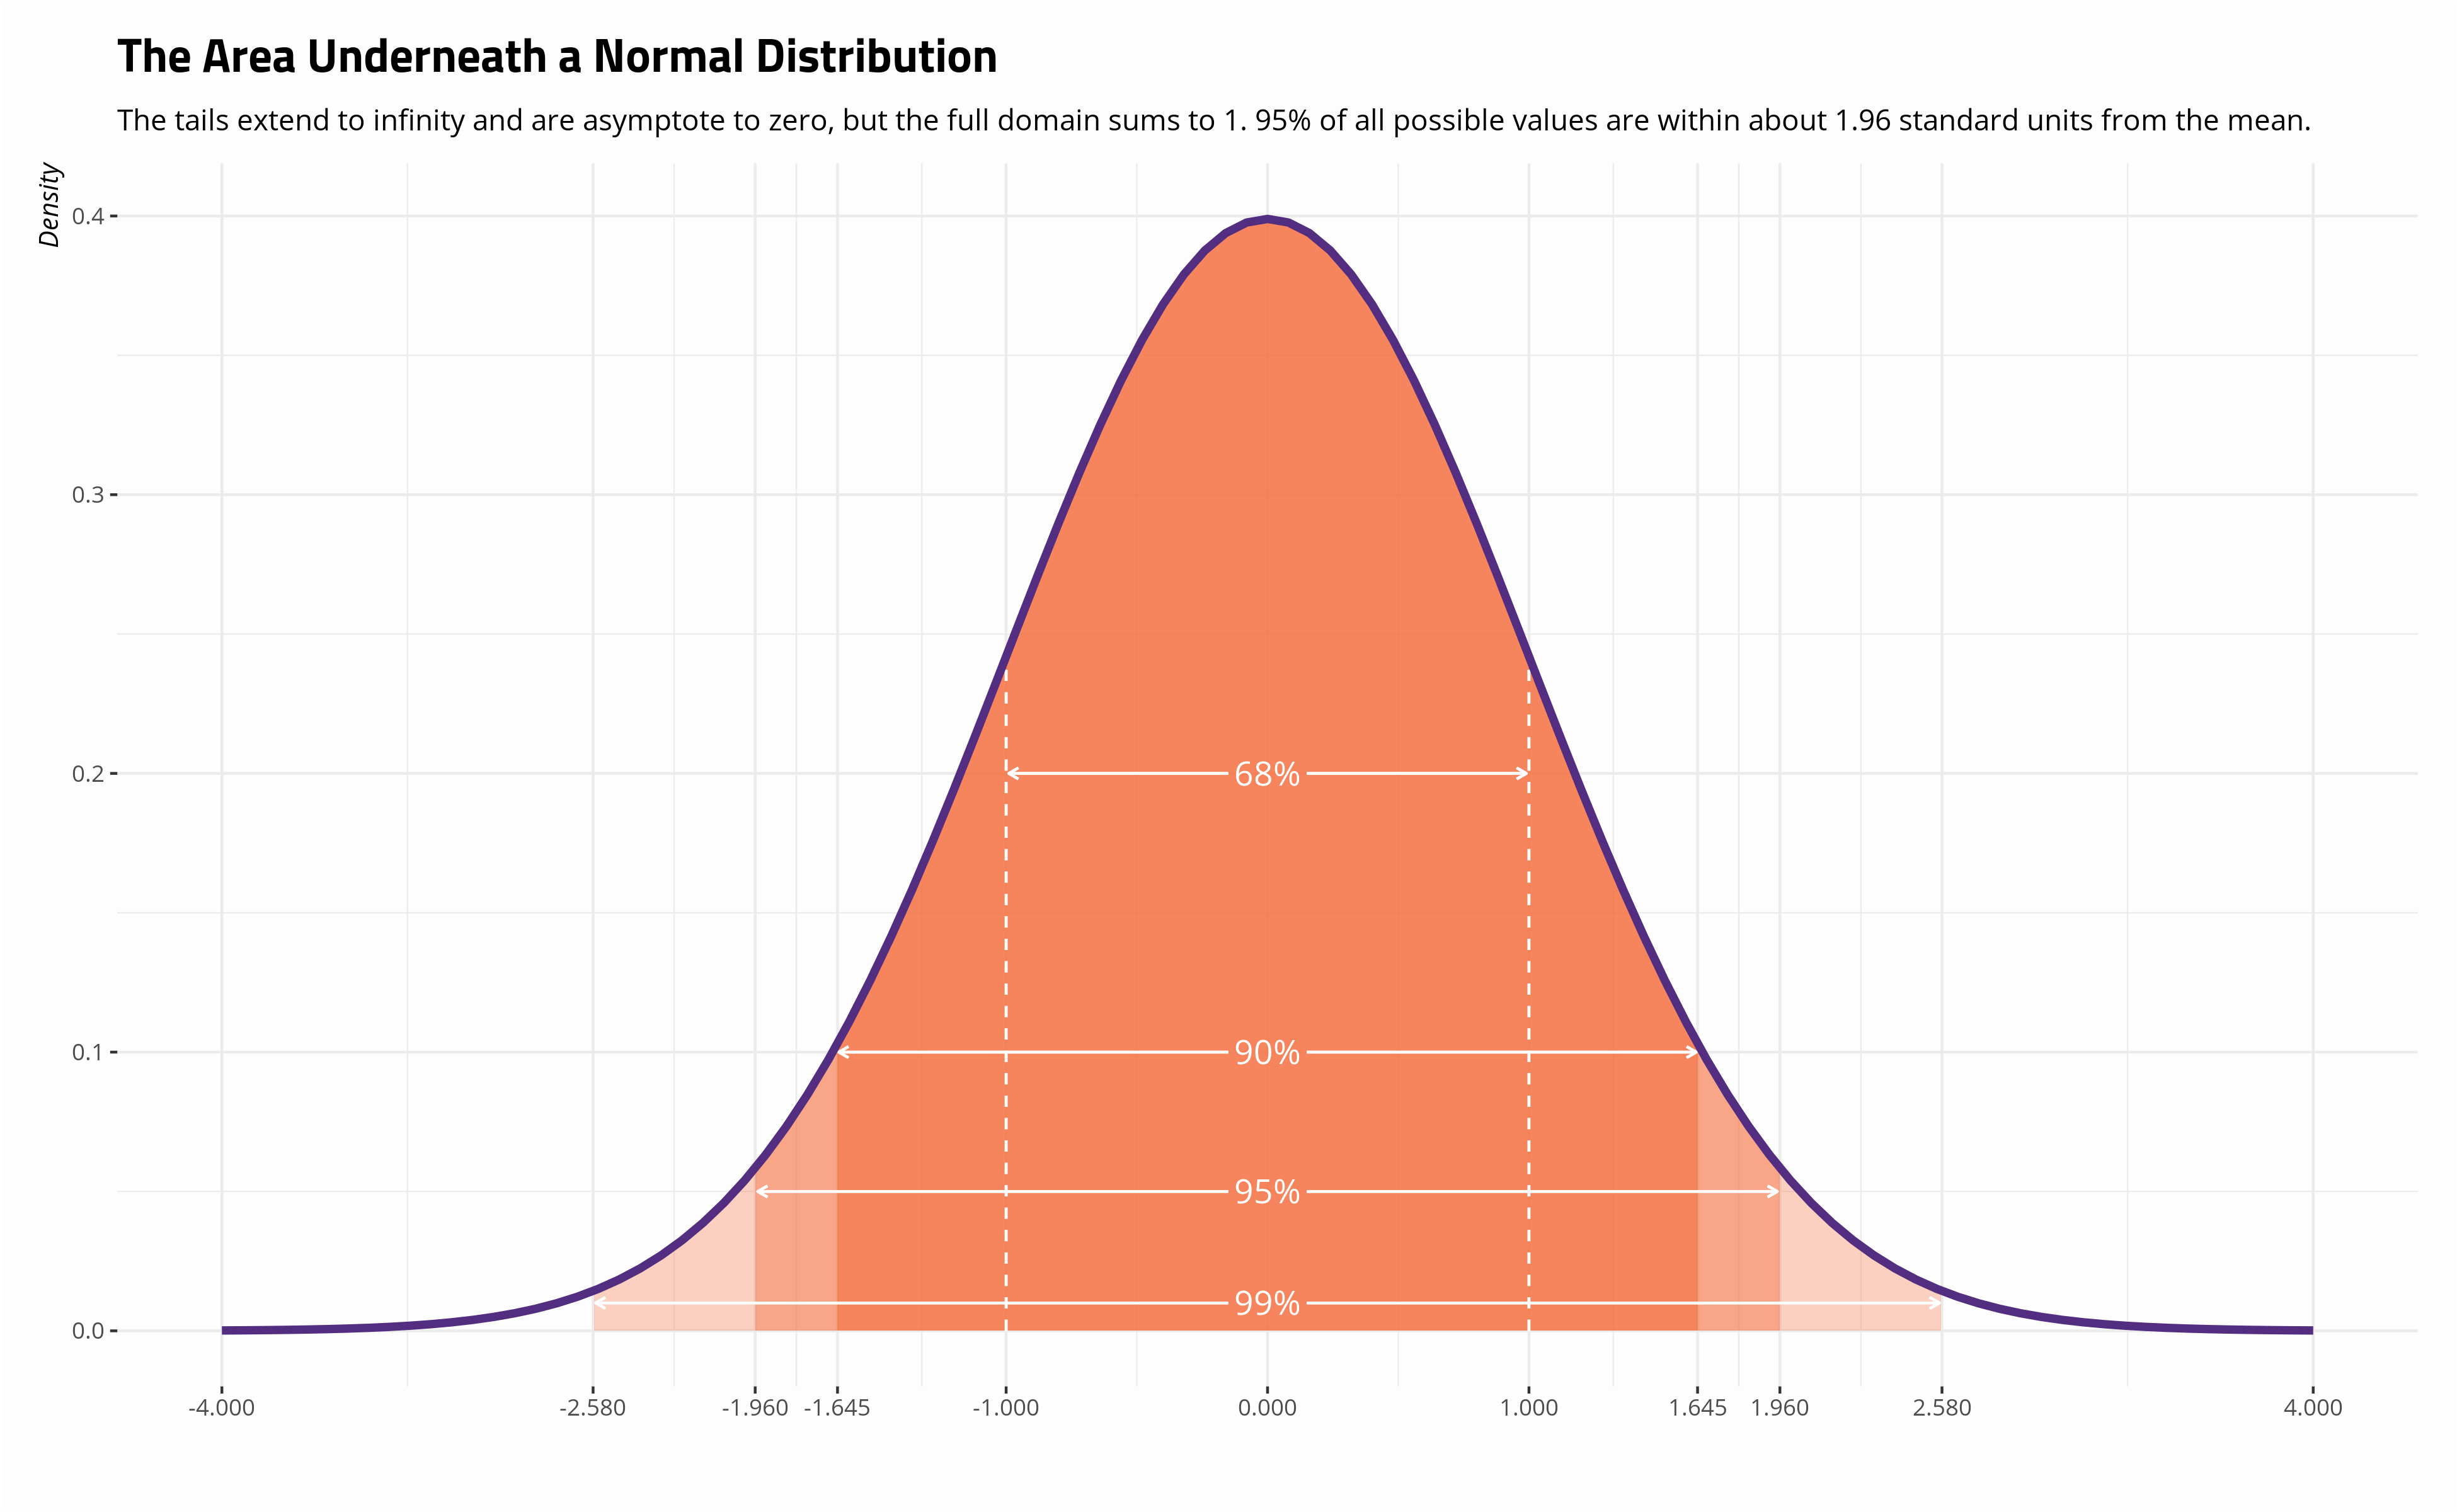
It features the following things:
• The distribution's mean, median, and mode are in agreement.
• There is a bell-shaped curve in the distribution.
• There is 1 in total area under the curve.
• The values are split exactly in half, with half to the right and half to the left of the center.
What's the difference between Eigenvectors and Eigenvalues?
Eigenvectors are column vectors or unit vectors having a length/magnitude of one. Right vectors are another name for them. Eigenvalues are coefficients that are applied to eigenvectors to give them variable length or magnitude values.
The process of decomposing a matrix into Eigenvectors and Eigenvalues is known as Eigen decomposition. These are then used to extract meaningful information from a matrix using machine learning techniques like PCA (Principal Component Analysis)
How does logistic regression work? Give an example of a time when you employed logistic regression recently.
Logistic regression is a type of regression analysis & a classification procedure that can be utilized when the dependent variable is binary. It determines the relationship between a dependent binary variable and one or more independent variables. Logistic regression is a predictive analytical technique.
Let's imagine we're trying to predict the outcome of elections for a specific political figure. So we want to know whether or not this candidate will win the election. As a result, the outcome is binary: win (1) or defeat (2). (0). The input, on the other hand, is a collection of linear variables such as advertising budgets, previous work by the leader and the party, and so on.
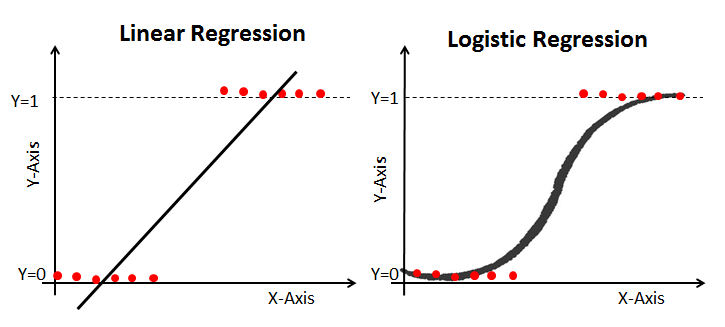
What do you understand by linear regression? What Are the Assumptions Required for a Linear Regression?
Linear regression aids in the comprehension of the relationship between the dependent and independent variables. It is a supervised learning algorithm with one predictor or independent variable and one response or dependent variable. Simple linear regression is used when there is only one independent variable, and multiple linear regression is used when there are more than one independent variable.
The simplest basic form of the linear regression equation, which has a degree of one, is Y = mX + C, where m is the line's slope and C is the standard error. When the response variable is continuous, like height, weight, or the number of hours, it is used. If there is a continuous dependent variable and one independent variable, it can be a basic linear regression, and if there are numerous independent variables, it can be a multiple linear regression.
Four major assumptions must be made.
1. The dependent variables and the regressors have a linear relationship, indicating that the model you are building truly fits the data.
2. The data's mistakes or residuals are regularly distributed and distinct from one another.
3. Multicollinearity between explanatory variables is not very high.
4. For all values of the predictor variable, homoscedasticity—the variation around the regression line—remains constant.
How do you keep your model from being overfit?
Overfitting is when a model is only trained on a tiny quantity of data and ignores the larger picture. To avoid overfitting, there are three main ways.
• Keep the model simple: take into account fewer variables, eliminating some of the noise in the training data.
• Cross-validation procedures, such as k folds cross-validation, should be used.
• Use regularisation techniques like LASSO to punish particular model parameters that are prone to overfitting.
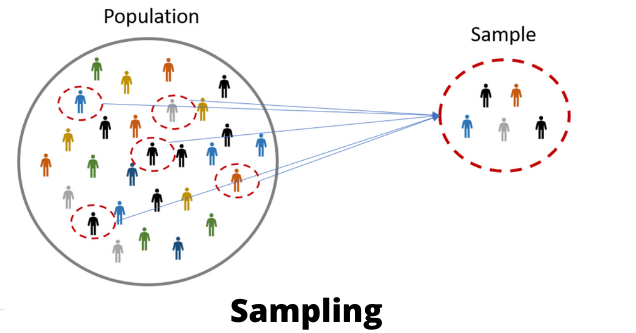
Mention some of the sampling approaches. What is the primary benefit of sampling?
The process of picking a sample from a group of individuals or from any particular kind for research purposes is known as sampling. It is one of the most crucial aspects in determining the accuracy of a study or survey outcome.
Especially when dealing with larger datasets, data analysis cannot be performed on the entire volume of data at once. It becomes essential to collect certain data samples that may be analyzed and used to represent the entire population. While doing this, it is imperative to carefully select sample data from the enormous data collection that accurately reflects the complete dataset.
Two types of sampling techniques:
Probability sampling:- It involves random selection, which ensures that each element has an equal chance of being chosen. There are several types of probability sampling, as listed below:
• Simple Random Sampling
• Stratified sampling
• Systematic sampling
• Cluster Sampling
• Multi-stage Sampling
Non- Probability Sampling:- Non-probability sampling is followed by non-random selection, which implies that the selection is made depending on your comfort or any other criteria you specify. This facilitates data collection. Various forms of sampling are included in it:
• Convenience Sampling
• Purposive Sampling
• Quota Sampling
• Referral /Snowball Sampling
What is the difference between long format data and wide format data?
| Long Format Data | Wide Format Data |
|---|---|
| A column for various variable types and a column for the values of those variables are included in long format data. | Wide format data, on the other hand, has a column for each variable. |
| In the Long format, each row represents one time point for each subject. As a result, each topic will have a large number of data rows. | In the wide format, a subject's repeated responses will appear in a single row, with each response in its own column. |
| To convert wide form to long form, use df.melt(). | Use df.pivot (), to convert long form to wide form, use reset index(). |
| The first column of a Long format contains values that repeat. | The values in a wide format do not repeat in the first column. |
| This data format is most commonly utilized in R analysis and at the end of each experiment for writing to log files. | This data format is commonly used in data processing and statistics programs for repeated measures ANOVAs, however, it is rarely utilized in R analysis. |
Explain bias-variance trade-off?
Bias:- When an ML Algorithm is oversimplified, it is a type of error in a machine learning model. When a model is trained, it makes simplified assumptions in order to understand the target function more simply. Decision Trees, SVM, and other low-bias algorithms are examples. The logistic and linear regression algorithms, on the other hand, have a large bias.
• Popular machine learning methods that score favorably for bias include the following: Decision trees, K-Nearest Neighbors, and Support Vector Machines (SVM).
• Those algorithms with a high bias score: both linear and logistic regression.
Variance:- Variance is a type of error as well. When an ML algorithm is made extremely complex, it is introduced into the model. Noise is also learned by this model from the training data set. It also fails miserably on the test data set. This can result in excessive lifting and heightened sensitivity.
We attempt to make the machine learning algorithm more complex while attempting to overcome bias in our model. Although it aids in bias reduction, it eventually leads to overfitting of the model, which leads to hypersensitivity and excessive variance.
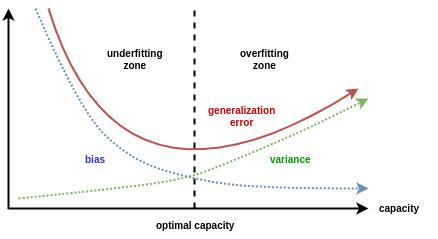
Bias-Variance trade-off:- The basic goal of a supervised machine learning algorithm is to have minimal variance and bias in order to obtain the greatest performance.
The following observations are made about several of the well-known machine learning algorithms:
• The Support Vector Machine (SVM) algorithm has a low bias and large variance. We can increase the parameter C to alter the trade-off. The C parameter alters the number of margin breaches that are permitted in training datasets, which increases bias and decreases variance.
• The K-Nearest Neighbors (KNN) Machine Learning algorithm has a low bias and a high variance compared to the SVM. By increasing the K value and hence the model bias, we can alter the algorithm's trade-off by boosting the prediction's ability to influence its immediate surroundings.
What is survivorship bias?
Survivorship bias is the logical fallacy of focusing on variables that promote surviving a process and casually neglecting others that do not due to their lack of prominence. This can lead to erroneous conclusions in a variety of ways.
What is Data Science variance?
Variance is an inaccuracy that occurs when a Data Science model becomes overly complex and learns properties from data while also accounting for noise. Even if the data and underlying patterns and trends are reasonably easy to identify, this type of error might occur if the model training technique is complex. As a result, the model is extremely sensitive, performing well on the training dataset but poorly on the testing dataset and on any type of data it has not previously encountered. In most cases, variance leads to poor testing accuracy and overfitting.
What do you mean when you say "imbalanced data"?
Highly imbalanced data is defined as data that is distributed unequally across numerous categories. These datasets cause a performance problem in the model and inaccuracies.
What is a decision tree? What are the steps in making a decision tree?
A decision tree is a supervised learning method for classifying and forecasting data. As a result, the dependent variable in this example can have both a numerical and a category value.
Each node is an attribute test, each edge is the attribute's result, and each leaf node is the class label. So, in this scenario, we have a succession of test circumstances, each of which leads to a different final decision.
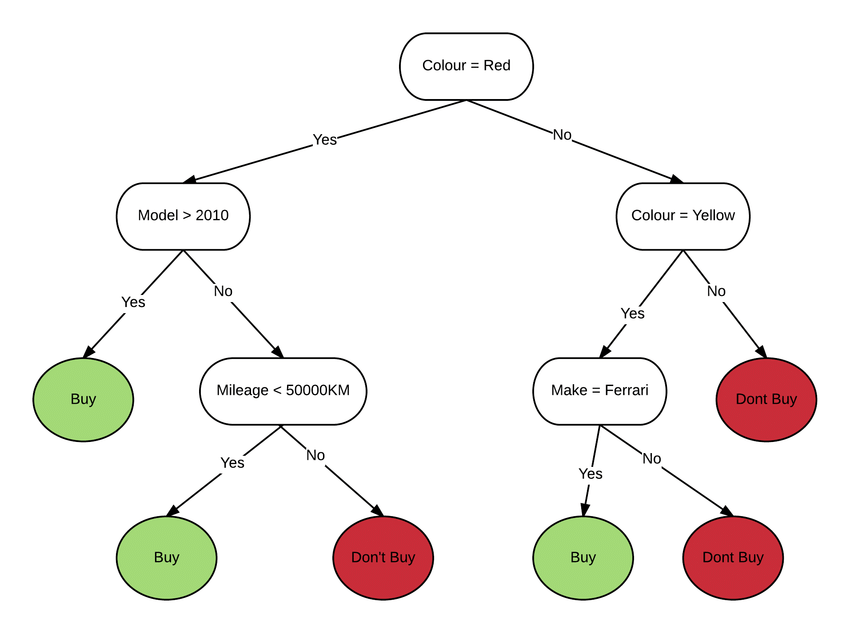
Following are the steps in making a decision tree:-
1. Assume that the complete data set is being used as input.
2. Search for a split that maximizes class separation. A split test is any test that divides data into two groups.
3. division the incoming data using the split (division step).
4. Steps one and two must be repeated for the divided data.
5. Stop when you reach any of the halting requirements.
6. This is known as pruning. If you go too far with the splits, clean up the tree.
What is a random forest? How do you build a random forest model?
A random forest is an ensemble machine learning model that combines multiple decision trees to make predictions.
Classification is critical in machine learning. It is critical to understand which class an observation belongs to. As a result, in machine learning, we have numerous classification methods such as logistic regression, support vector machine, decision trees, Naive Bayes classifier, and so on. The random forest classifier is one such classification approach that is near the top of the classification hierarchy.
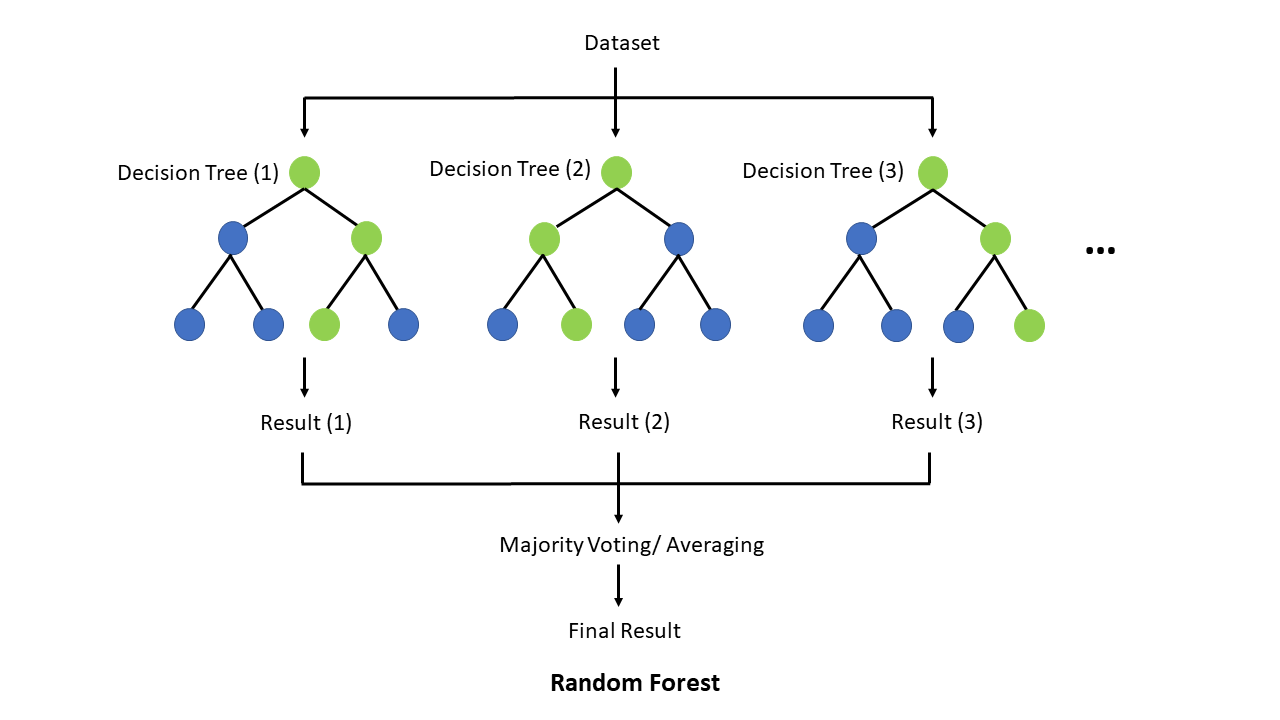
Here are the steps on how to build a random forest model:
1. Gather your data.
2. Choose the number of trees in your forest.
3. Choose the number of features to consider at each split.
4. Train the forest on your data.
5. Make predictions on new data.
Here are some additional things to keep in mind when building a random forest model:
• Random forests are a type of ensemble learning algorithm, which means that they combine the predictions of multiple models to improve accuracy.
• Random forests are relatively robust to overfitting, meaning that they are less likely to learn the training data too well and make poor predictions on new data.
• Random forests can be used for both classification and regression tasks.
What do true positive rate and false positive rate mean to you?
TPR:- The ratio of True Positives to True Positives and False Negatives is known as the True Positive rate (TPR). It's the likelihood that a true positive will test positive.
The True Positive Rate (TPR) is computed by dividing the number of [True Positives (TP)] by the number of [True Positives (TP) & False Negatives (FN)].
FPR:- The ratio of False Positives to all Positives is known as the False Positive Rate (FPR) (True positives and false positives). It is the likelihood of a false alarm, in which a positive result is reported when the true result is negative.
The False Positive Rate (FPR) is computed by dividing the number of [False Positives (FP)] by the number of [True Positives (TP) and False Positives (FP)].
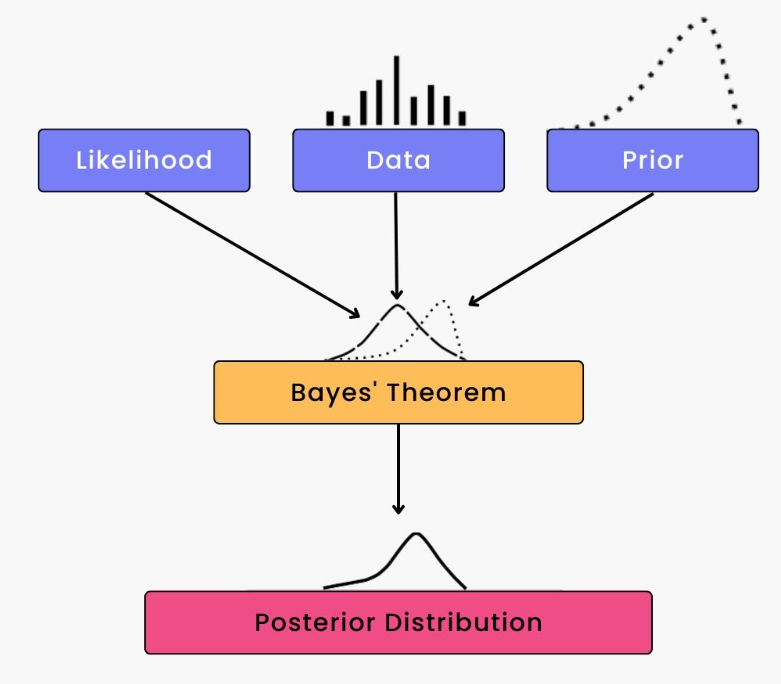
What does 'Naive' mean in the context of Naive Bayes?
A naïve Bayes classifier assumes that the existence (or lack) of a certain characteristic of a class is unrelated to the presence (or absence) of any other feature, given the class variable.
It uses the word 'naive' since each variable in the dataset is assumed to be independent of the others. This kind of assumption is impossible to make with real-world facts. Even with this assumption, it can help with a variety of tough problems, such as spam email classification.
Why Is Re-sampling Done? When it is done?
Re-sampling is a technique for sampling data that is used to increase precision and quantify the uncertainty of population parameters. By training the model on various dataset patterns, it is made sure that variations are handled and that the model is adequate. Additionally, it is done while doing tests on data points with different labels or when validating models using random subsets.
Resampling is done in any of the following circumstances:
• using accessible subsets of data to estimate the accuracy of sample statistics, or selecting randomly with replacement from a set of data points
• labels on data points are replaced when significance tests are run
• Using random subsets to validate models (bootstrapping and cross-validation)
What are the confounding variables?
Confounders are sometimes referred to as confounding variables. These variables are a particular category of auxiliary variables that have an impact on both independent and dependent variables, leading to erroneous mathematical relationships between variables that are correlated but are not incidentally related to one another.
Are there any differences between the expected value and mean value?
Although there aren't many variations between the two, it should be noted that they are employed in various situations. While the expected value is typically associated with random variables, the mean value typically refers to the probability distribution.
How is Data Science different from traditional application programming?
• Building systems that deliver value requires a fundamentally different strategy from typical application development, and this strategy is called data science.
• In conventional programming paradigms, we used to examine the input, determine the desired outcome, and then write code that contained the necessary rules and statements to convert the supplied input into the desired outcome. As you may guess, it was difficult to design these rules for data like photos, videos, and other types of data that even computers struggled to comprehend.
• Data science slightly modifies this method. We require access to a lot of data in it, including the essential inputs and how they relate to the desired outcomes. Then, we apply data science algorithms, which create rules for mapping the provided inputs to Outputs.
• Training is the name given to this rule creation process. After training, we test and evaluate the system's accuracy using some data that was saved before training. Since the created rules are essentially a "black box," we are unable to discern how the inputs are changed into the outputs.
• But if the precision is sufficient, we can use the system (also known as a model).
• As previously said, in traditional programming, the rules needed to map input to output had to be written; however, in data science, the rules are either generated automatically or are learned from the provided data. This assisted in resolving some pretty challenging problems that multiple businesses were dealing with.
What is dimensionality reduction?
Dimensionality reduction is the process of transforming a dataset with a large number of dimensions (fields) to a dataset with fewer dimensions. To achieve this, a few fields or columns are removed from the dataset. But this is not carried out carelessly. In this method, the dimensions or fields are only removed after confirming that the remaining data will still be sufficient to briefly represent related data.
Dimensionality reduction has the following advantages:
• It lessens the amount of storage needed for machine learning applications.
• A machine learning model's results are simpler to interpret.
• When the dimensionality is decreased to two or three parameters, it is simpler to visualize the results, allowing for 2D and 3D visualizations.
In Data Science, Why Is Python Used for Data Cleaning?
Python is used for data cleaning because it is a versatile and powerful language that has a large number of libraries and tools specifically designed for data science tasks. Two of the most popular libraries for data cleaning in Python are NumPy and Pandas.
• NumPy is a library for scientific computing that provides a high-performance array data structure and a wide range of mathematical functions. It can be used to quickly and easily manipulate data, such as removing outliers, filling in missing values, and transforming data into different formats.
• Pandas is a library for data analysis that provides a high-level interface for working with tabular data. It can be used to load data from a variety of sources, clean and transform data, and perform statistical analysis.
Together, NumPy and Pandas provide a powerful toolkit for data cleaning. They are used by data scientists and machine learning engineers around the world to prepare data for analysis and modeling.
Here are some specific tasks that NumPy and Pandas can be used for in data cleaning:
• Identifying and removing outliers
• Filling in missing values
• Transforming data
Before implementing machine learning algorithms, what are some of the procedures for data wrangling and data cleaning?
When it comes to data wrangling and data cleaning, there are several options. These are some of the most common steps:
Data profiling: Almost everyone begins by familiarising themselves with their dataset. You can use shape to see the form of the dataset, and .describe() to see a description of your numerical variables ().
Data visualizations: To better understand the relationships between variables and detect potential outliers, you can use histograms, boxplots, and scatterplots to depict your data.
Syntax error: This includes checking for mistakes, ensuring there is no white space, and ensuring letter casing is consistent. .unique() and bar graphs can both be used to check for mistakes.
Standardization or normalization: It may be necessary to standardise or normalise your data, depending on the dataset and machine learning approach you use, so that various scales of distinct variables do not negatively effect the performance of your model.
Handling null values: Null values can be handled in a variety of ways, including deleting rows with null values entirely, replacing null values with the mean/median/mode, replacing null values with a new category (e.g. unknown), Using machine learning models that can handle null values or predicting values.
What are the most widely used libraries in Data Science?
Some of the most popular libraries for data extraction, cleaning, visualisation, and deployment of DS models are listed below:
Tensorflow: Supports parallel computing with Google's excellent library management.
SciPy: Graphs and charts are commonly used to solve differential equations, multidimensional programming, data manipulation, and visualisation.
Pandas: Used in business applications to implement ETL (Extracting, Transforming, and Loading datasets) capabilities.
Matplotlib: Because it is free and open-source, it can be used in place of MATLAB, resulting in improved performance and lower memory usage.
PyTorch: The best tool for projects involving deep neural networks and machine learning techniques.
Explain the Law of Large Numbers?
The 'Law of Large Numbers' states that if an experiment is independently performed a large number of times, the average of the individual results is likely to be close to the value predicted. Additionally, it says that both the sample variance and standard deviation are heading in the direction of the predicted value.
Define the terms KPI, Lift, model fitting, robustness, and DOE.
• KPI stands for Key Performance Indicator, which gauges how well a company accomplishes its goals.
• Lift is a performance indicator for the target model compared to a random selection model. Lift measures how well the model predicts in comparison to no model.
• Robustness refers to how well the system can manage variations and changes.
• DOE is an acronym for "design of experiments," which refers to a task that aims to characterize and explain information variance in the presence of factors.
What is Deep Learning?
Deep Learning is a type of machine learning in which neural networks are used to mimic the structure of the human brain. Machines are taught to learn from the information that is given to them in the same way that a brain does.
Deep Learning is a more sophisticated form of neural networks that allows computers to learn from data. The term "deep learning" refers to the use of neural networks that have multiple hidden layers that are coupled to one another, with the output of one layer serving as the input of another.
Which algorithm is responsible for Amazon's 'People who bought this also bought...' recommendations?
The recommendation engine is accomplished with collaborative filtering. Collaborative filtering reveals how other users behave and what they've bought in terms of ratings, selection, and so on.
Based on the tastes of other users, the engine develops predictions about what could interest a person. The item features in this algorithm are unknown.
A sales page, for example, may display that a specific number of individuals purchase a new phone and toughened glass at the same time. When a person purchases a phone in the future, he or she may receive a recommendation to get toughened glass as well.
What is the significance of R in data visualisation?
R is the best ecosystem for data analysis and visualisation, with over 12,000 packages in open-source sources. It has a wide community, so you can discover answers to your problems rapidly on sites like StackOverflow.
By distributing activities among several tasks and nodes, it enhances data management and promotes distributed computing, lowering the complexity and execution time of large datasets.
In a decision tree algorithm, what information is gained?
We must construct a node at each level of the decision tree that chooses which feature to use to split data, i.e., which feature will best separate our data so that we can make predictions . This decision is based on information gain, which is a measurement of how much entropy is reduced when a specific characteristic is used to split data. The feature that is selected to separate the data provides the most information gain.
What if a dataset contains variables with more than 30% missing values? How would you deal with such a dataset?
We use one of the following methods, depending on the size of the dataset:
If the datasets are small, the missing values are replaced with the mean or average of the remaining data. This may be done in pandas by using mean = df.mean(), where df is the pandas dataframe that contains the dataset and mean() calculates the data's mean. We may use df.fillna to fill in the missing numbers with the calculated mean (mean).
The rows with missing values can be deleted from larger datasets, and the remaining data can be used for data prediction.
You've been provided a cancer detection dataset. You created a classification model with a 96 percent accuracy rate. Why shouldn't you be pleased with your modelling abilities? What are your options?
As a result of cancer detection, data is unbalanced. Accuracy should not be used as a performance indicator in an unbalanced dataset. It's critical to concentrate on the remaining 4%, which includes patients who were misdiagnosed. When it comes to cancer detection, early detection is critical and can significantly enhance a patient's prognosis.
To determine the class wise performance of the classifier, we should utilise the Sensitivity (True Positive Rate), Specificity (True Negative Rate), and F measures.
Give an example in which both false positives and false negatives are equally important.
The principal source of revenue in the banking business is loan lending. However, if the payback rate is low, there is a chance of large losses rather than gains. Giving out loans to clients is a gamble since banks cannot afford to lose good customers while also being unable to gain poor customers. This is a famous example of how false positive and false negative scenarios are equally important.
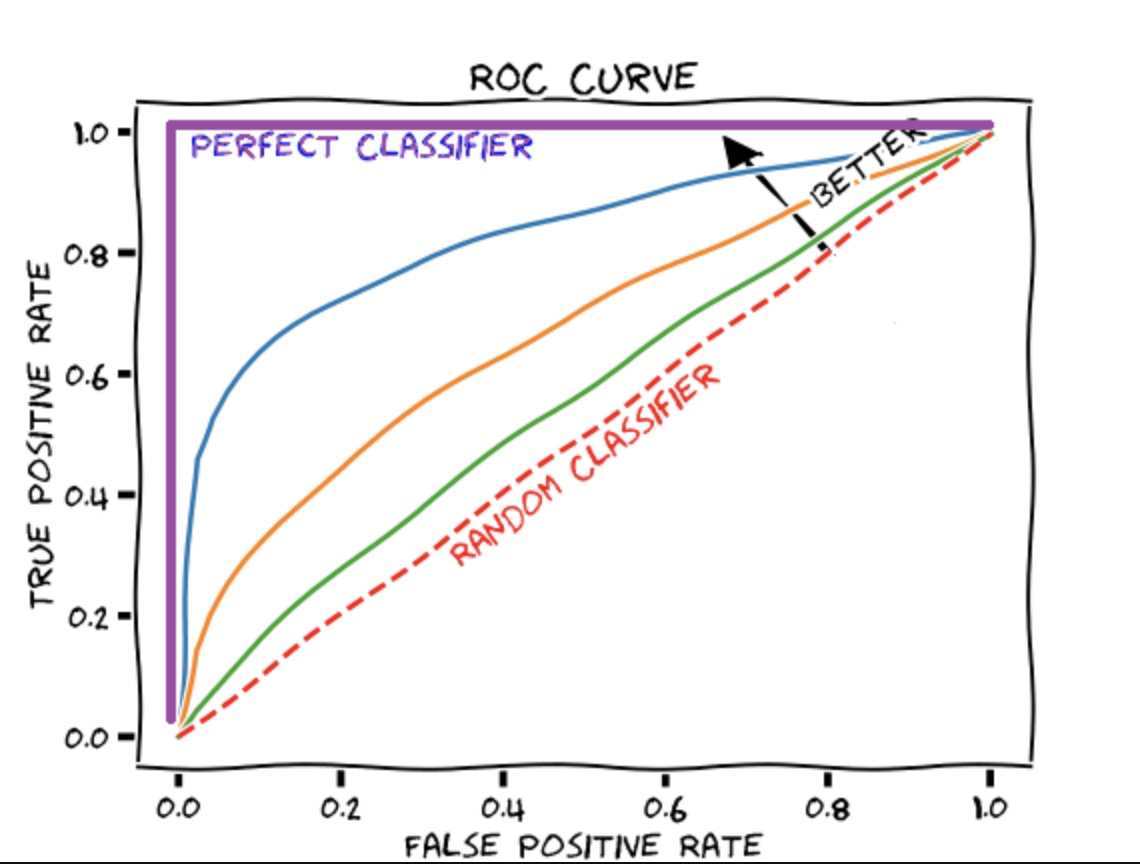
What does the ROC curve stand for?
Receiver Operating Characteristic is what it's called. It is essentially a plot of a true positive rate vs a false positive rate that aids us in determining the best tradeoff between the true positive rate and the false positive rate for various probability thresholds of anticipated values. The better the model, the closer the curve is to the upper left corner. In other words, the curve with the most area beneath it is the best model.
Write code to calculate the root mean square error (RMSE) using the actual and anticipated lists of values?
To find the root mean square error (RMSE), we must do the following:
Calculate the errors, or the variations between the actual and projected numbers.
Each of these errors should be squared.
Determine the average of these squared errors.
Return the mean's square root.
def rmse(actual, predicted):
  errors = [abs(actual[i] - predicted[i]) for i in range(0, len(actual))]
  squared_errors = [x ** 2 for x in errors]
  mean = sum(squared_errors) / len(squared_errors)
  return mean ** .5
Mention the various kernel functions available in SVM?
Kernel functions are divided into four categories:
Linear kernel
Polynomial kernel
Radial basis kernel
Sigmoid kernel
What does A/B testing entail?
A/B testing is a type of statistical hypothesis testing used in randomised experiments involving two variables. The letters A and B stand for these variables. A/B testing is used when we wish to test a new feature in a product. We give users two variants of the product in the A/B test, and we designate these variants A and B.
The A variant could be the one having the new functionality, whereas the B variant could be without it. We collect product ratings after users have used these two products.
If the new feature is statistically and significantly better than product variant A, it is considered an improvement and helpful, and it is adopted. Otherwise, the product's new functionality is withdrawn.
What is reinforcement learning and how does it work?
Reinforcement learning is a type of Machine Learning that focuses on creating software agents that undertake activities in order to maximise the quantity of cumulative rewards.
A reward is used to inform the model (during training) if a specific activity leads to the achievement of or progress toward the objective. For example, if we design a machine
learning model that plays a video game, the reward will be either the points earned or the game level reached.
Reinforcement learning is used to create these types of agents that can make real-world decisions that will help the model achieve a clearly defined goal.
What Exactly is Dropout?
Dropout is a term used in data science to describe the process of randomly removing hidden and visible network units. They avoid data overfitting by removing up to 20% of nodes to make room for iterations to converge the network.
What is the definition of root cause analysis?
Originally created to investigate industrial accidents, root cause analysis is now widely employed in a variety of fields. It's a problem-solving method for determining the source of flaws or difficulties. When a factor is removed from the problem-fault-sequence, it prevents the final unwanted event from occurring.
Explain cross-validation?
Cross-validation is a model validation technique for testing how well the findings of a statistical study will generalise to new data. It's mostly employed in situations when the goal is to forecast and you want to know how accurate a model will perform in practise.
The purpose of cross-validation is to create a data set to test the model in the training phase (i.e. validation data set) in order to avoid issues like overfitting and get insight into how the model will generalise to a different data set.
What is the difference between correlation and covariance in statistics?
Both covariance and correlation are mathematical notions that are commonly utilised in statistics. Correlation and covariance are both used to build and measure the relationship between two random variables. Despite the fact that their job is mathematically comparable, they are not the same.
Correlation: Correlation is regarded as the most effective method for determining and assessing the quantitative relationship between two variables. Correlation measures the strength of a link between two variables.
Covariance: Covariance is a statistic that measures the extent to which two random variables change in cycle when they fluctuate together. It's a statistical term for the systematic relationship between two random variables in which changes in one are proportional to changes in the other.
What are the disadvantages of using a linear model?
• The linearity of the mistakes assumption
• It is not suitable for count or binary results.
• It is unable to fix some overfitting issues.
What role does dimensionality reduction play?
Dimensionality reduction is the process of lowering the amount of features in a dataset in order to minimise overfitting and reduce variance.
Advantages of this processes are:
• This saves both store space and model execution time.
• Removes the problem of multi-collinearity, enhancing the ML model's parameter interpretation.
• When the dimensions are lowered, it becomes easier to visualise data.
Is it possible to make a stronger predictive model by considering categorical variables as continuous variables?
Yes! A categorical variable is one that has no particular category ordering and can be allocated to two or more categories. Ordinal variables are comparable to categorical variables in that they have a defined and consistent ordering. Treating the categorical value as a continuous variable will result in stronger prediction models if the variable is ordinal.
🚀Conclusion
This page has finally come to a conclusion. You should be able to design your own programmes with the material on this page and little study, and small projects are actually encouraged for improving your programming skills. A single course cannot possibly cover everything you need to know to be a good programmer. Programming is a never-ending learning process, whether you're a seasoned professional developer or a total beginner.
TEST YOUR KNOWLEDGE!
1. Which of the following is one of the key data science skills?
2. Which of the following is characteristic of Processed Data?
3. Which of the following is correct about regularized regression?
4. Which of the following thing can be data in Pandas?
5. Which of the following function is associated with a continuous random variable?
6. Which of the following implies no relationship with respect to correlation?
7. Which of the following is an example of raw data?
8. Which of the following is an example of tidy data?
9. Which of the following package is used for tidy data?
10. Raw data in the real-world is tidy and properly formatted?
Logicmojo Learning Library
Data Science, ML & Analytics
C Language
C++ Language
Data Structures and Algorithms
OOPS (Object Oriented)
SQL & Database
Java
Python
Operating System & Networking
Interview Questions
System Design
Cloud Deployment
Automation

logicmojoContact
HAVE A QUESTION? GIVE US A CALL OR CONTACT US - WE'D LOVE TO HEAR FROM YOU
PHONE: +91 80889-75867